

Question: Table: Survey resultsConstruct a histogram,five to six intervals. Frequency and number of pairs of shoesFigure 2.30Calculate the following values. x??x = _____s = _____Are the
Table: Survey resultsConstruct a histogram,five to six intervals. Frequency and number of pairs of shoesFigure 2.30Calculate the following values. x??x = _____s = _____Are the data discrete or continuous?describe the shape of the histogram.Are there any potential outliers? List the value(s) that could be outliers. Use a formula to check the end values to determine if they are potential outliers.Analyze the DataDetermine the following values.Min = _____M = _____Max = _____Q1 = _____Q3 = _____IQR = _____Construct a box plot of dataShow your work to find the value that is 1.5 standard deviations:above the mean.below the mean.
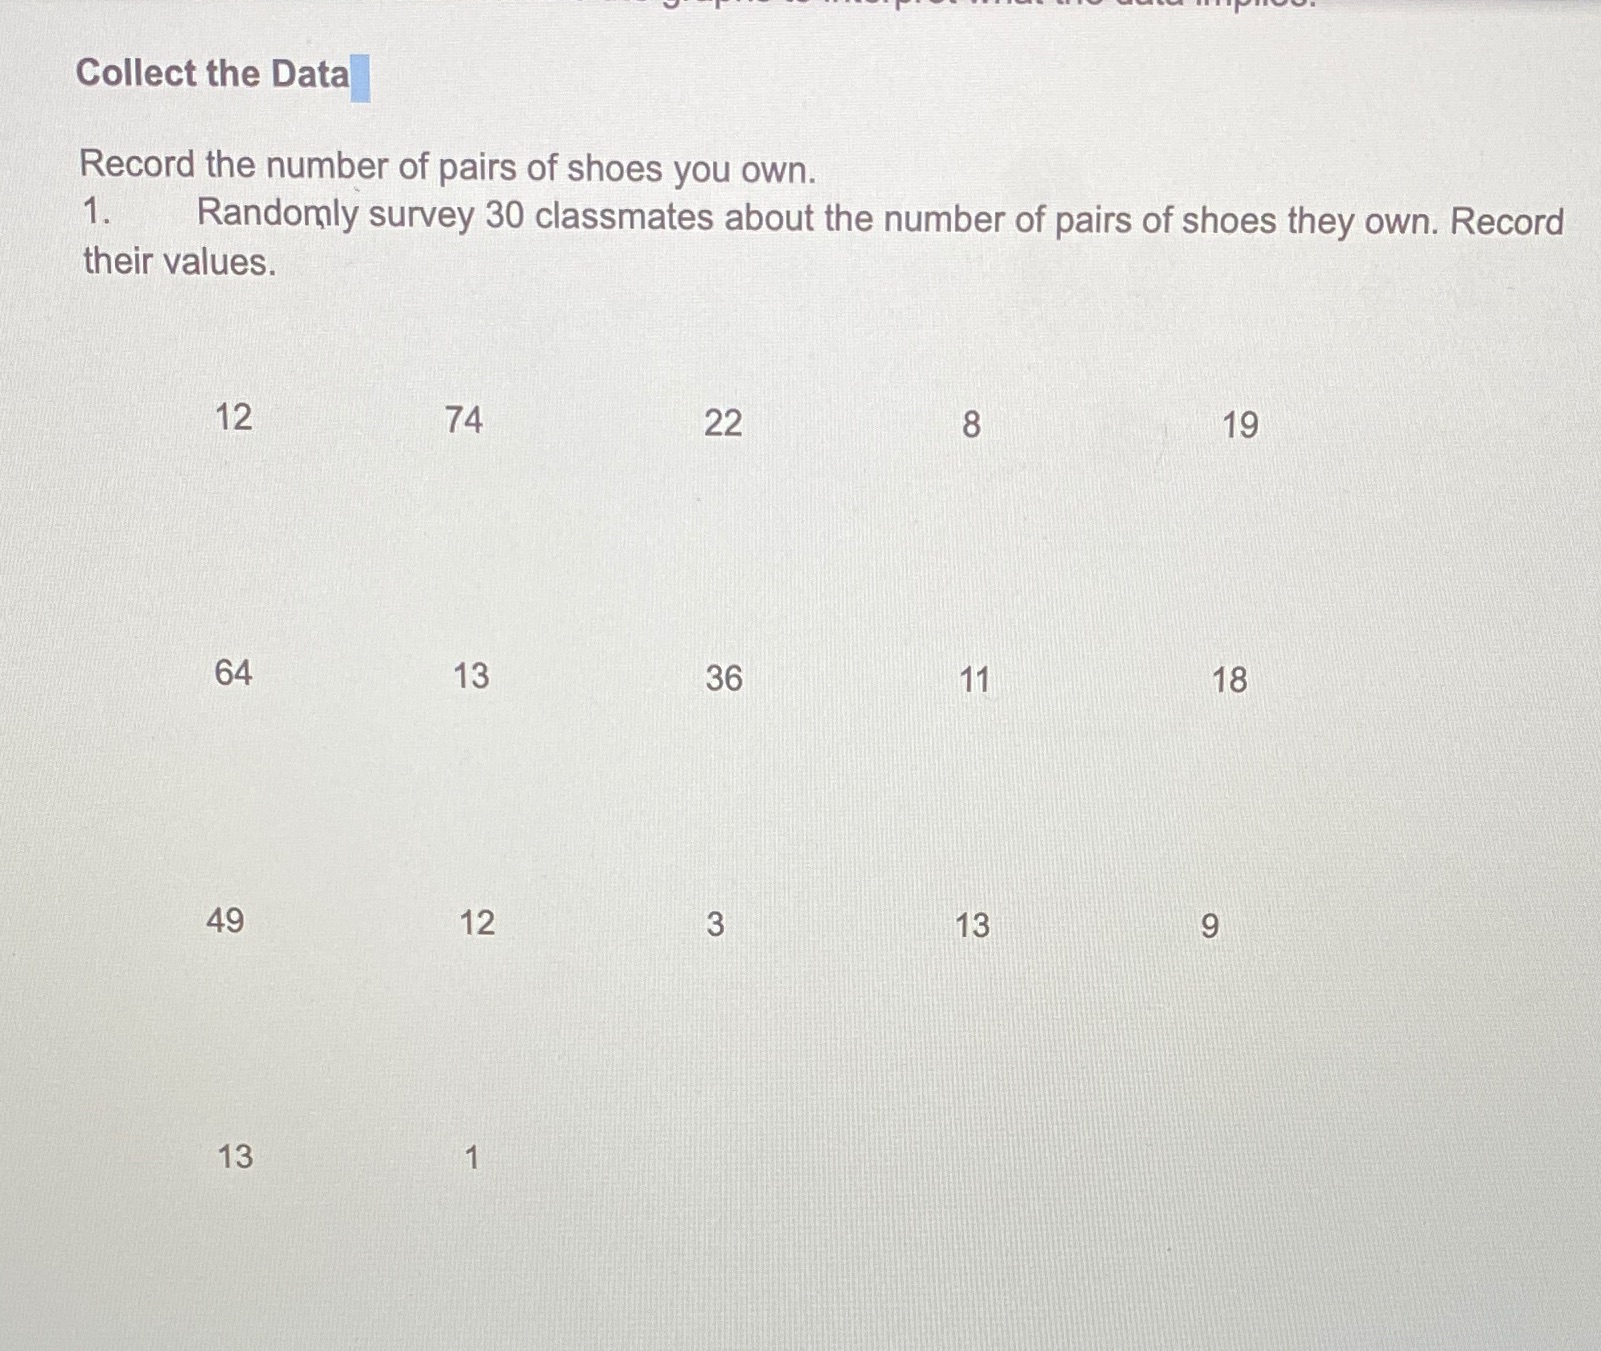
Collect the Data Record the number of pairs of shoes you own. 1. Randomly survey 30 classmates about the number of pairs of shoes they own. Record their values. 12 74 22 8 19 64 13 36 11 18 49 12 3 13 9 13
Step by Step Solution
There are 3 Steps involved in it

Get step-by-step solutions from verified subject matter experts