

Question: Table Task 1-1) Create a pivot table that summarizes the average of Total Delay for each station. The pivot table should look like the following
Table Task 1-1) Create a pivot table that summarizes the average of "Total Delay" for each station. The pivot table should look like the following
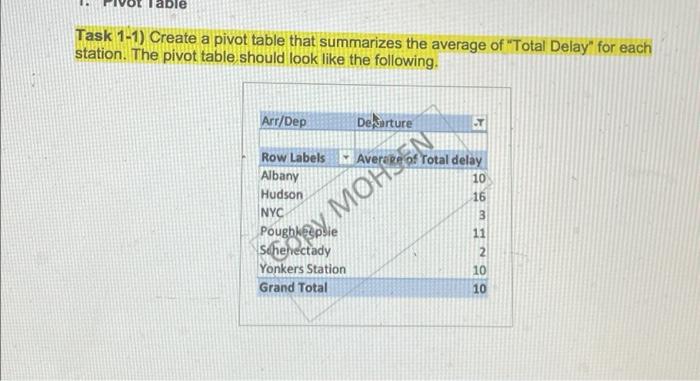
Task 1-1) Create a pivot table that summarizes the average of "Total Delay" for each station. The pivot table should look like the following. Task 1-1) Create a pivot table that summarizes the average of "Total Delay" for each station. The pivot table should look like the following
Step by Step Solution
There are 3 Steps involved in it
1 Expert Approved Answer
Step: 1 Unlock

Question Has Been Solved by an Expert!
Get step-by-step solutions from verified subject matter experts
Step: 2 Unlock
Step: 3 Unlock