

Question: ( Table ) The table shows coffee and tea units produced for the United States and Japan. The opportunity costs are table [ [
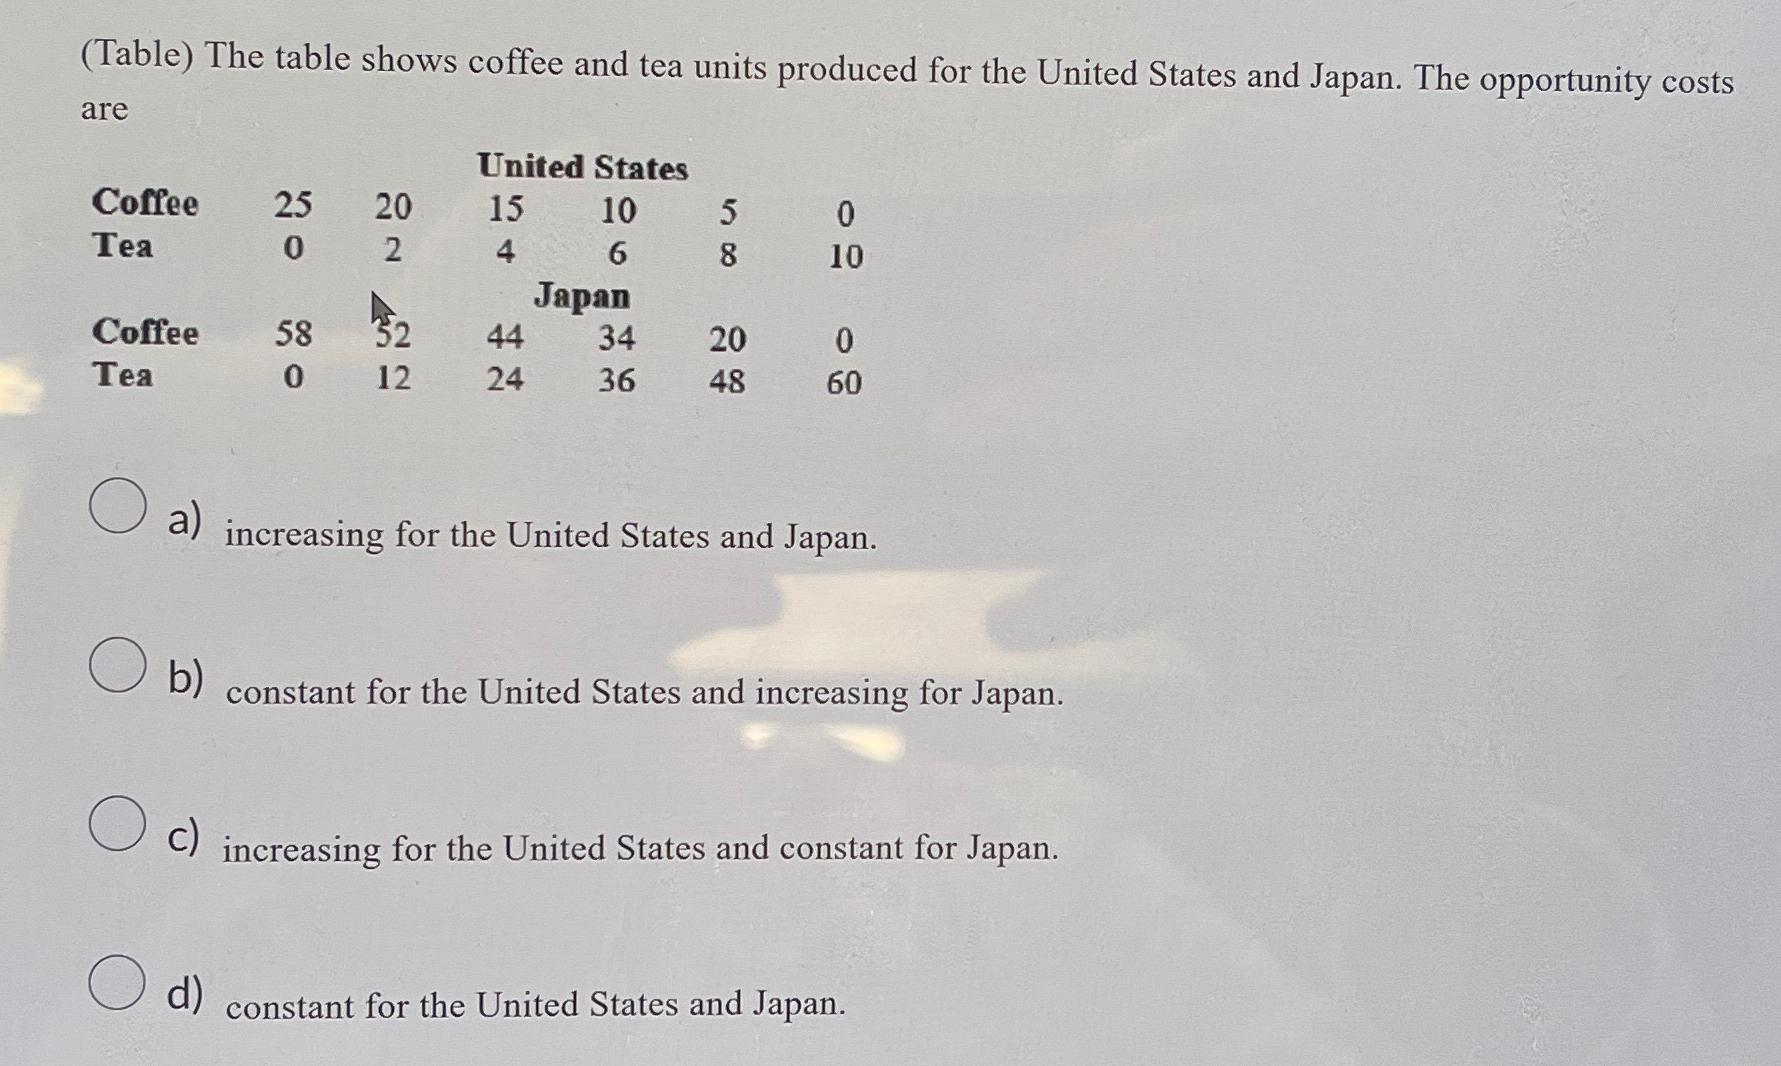
Table The table shows coffee and tea units produced for the United States and Japan. The opportunity costs are
tableUnited StatesCoffeeTeaJapan,,,CoffeeTea
a increasing for the United States and Japan.
b constant for the United States and increasing for Japan.
C increasing for the United States and constant for Japan.
d constant for the United States and Japan.
Step by Step Solution
There are 3 Steps involved in it
1 Expert Approved Answer
Step: 1 Unlock

Question Has Been Solved by an Expert!
Get step-by-step solutions from verified subject matter experts
Step: 2 Unlock
Step: 3 Unlock