

Question: table [ [ Woibools Carse Materials Mitallourcel Crades,The difference between the upper and lower control limits of an x - bar chart for a
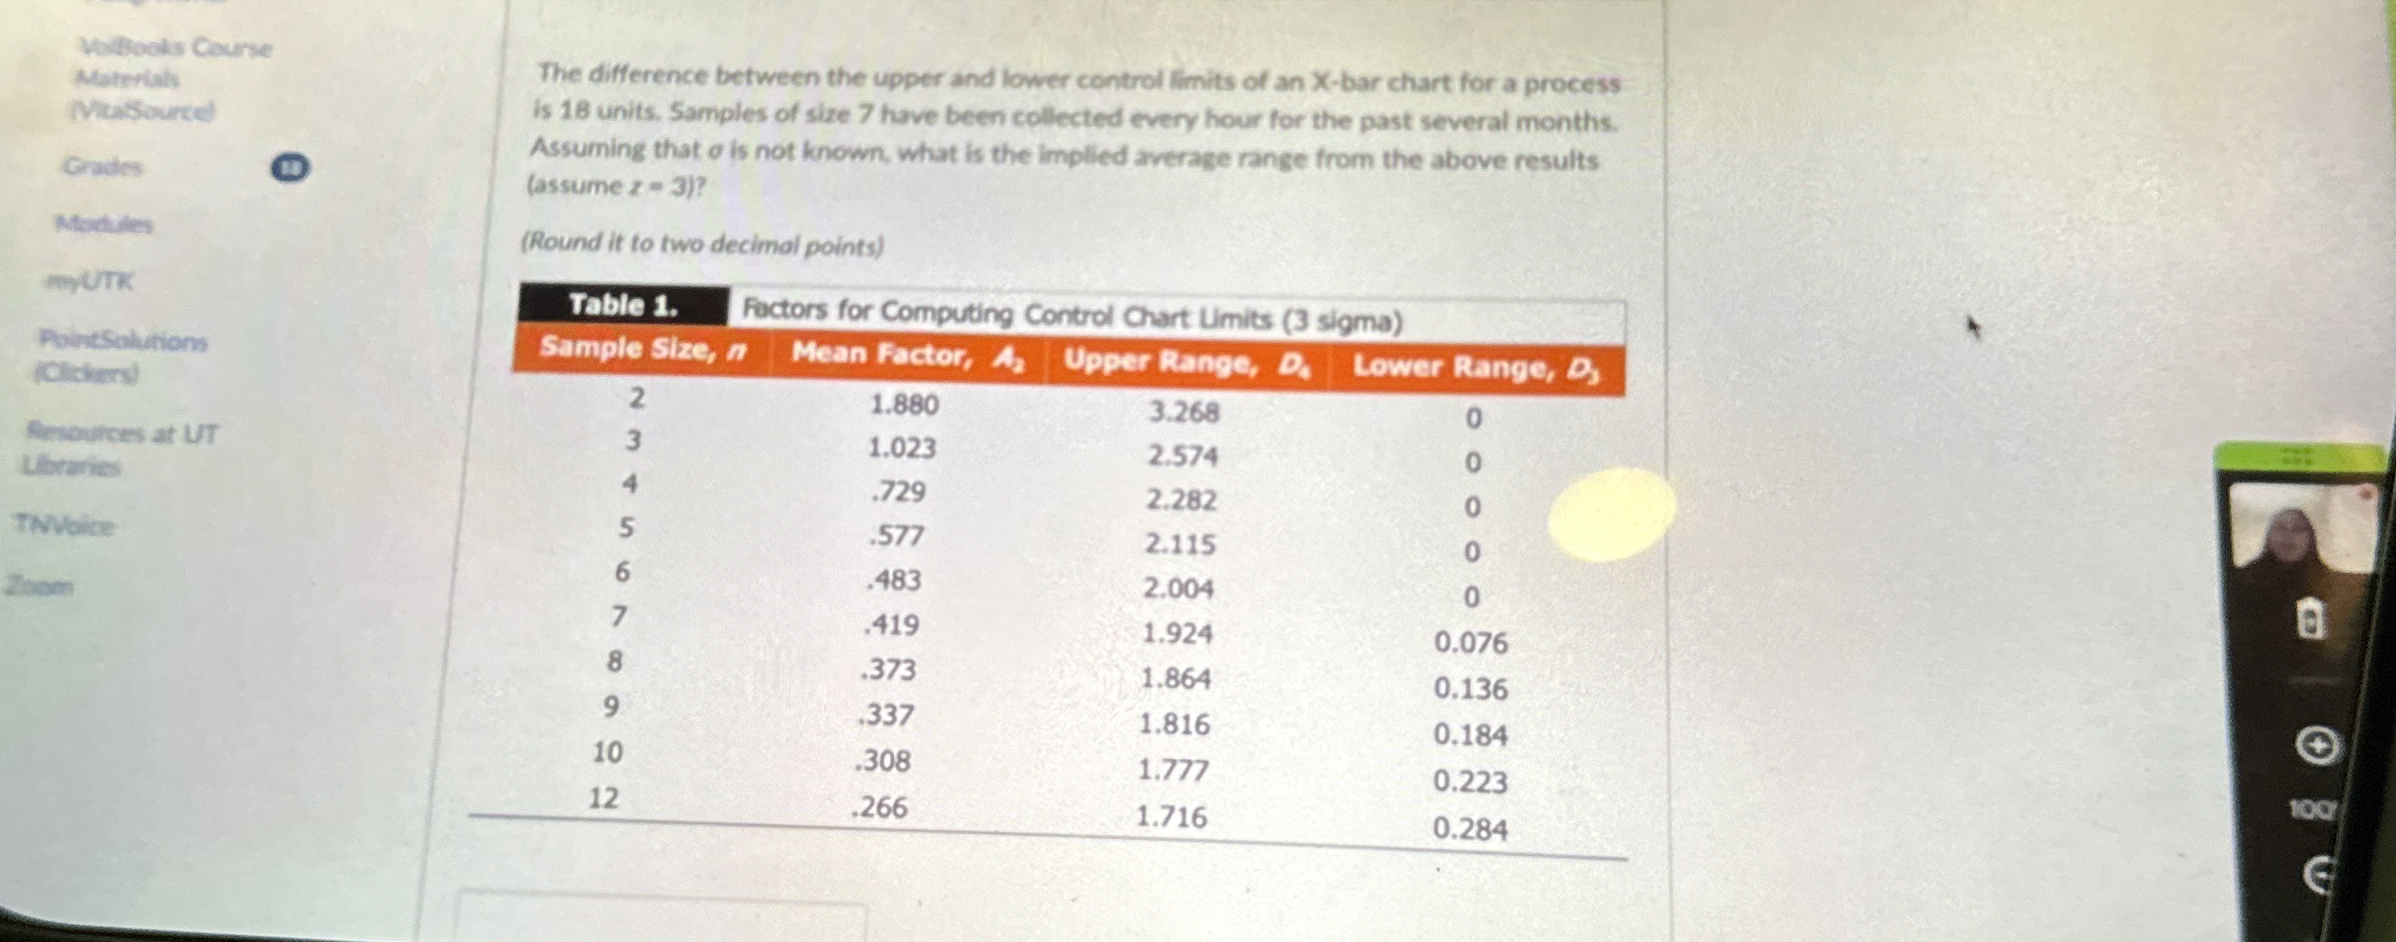
tableWoibools Carse Materials Mitallourcel Crades,The difference between the upper and lower control limits of an bar chart for a process is units. Samples of size have been collected every hour for the past several months. Assuming that is not known, what is the implied average range from the above results assume ModilesRound it to two decimal pointsmituTKTable Factors for Computing Control Chart Umits sigmatableAnteculansClidersSimple Size, Mean Factor, Upper Range, DuLower Range,
Step by Step Solution
There are 3 Steps involved in it
1 Expert Approved Answer
Step: 1 Unlock

Question Has Been Solved by an Expert!
Get step-by-step solutions from verified subject matter experts
Step: 2 Unlock
Step: 3 Unlock