Question: Table-1 Estimated 2005 Income Statement and Balance Sheet Data for Ideko Corporation Year 2005 Year 2005 Income Statement ($ 000) Balance Sheet ($ 000) 1
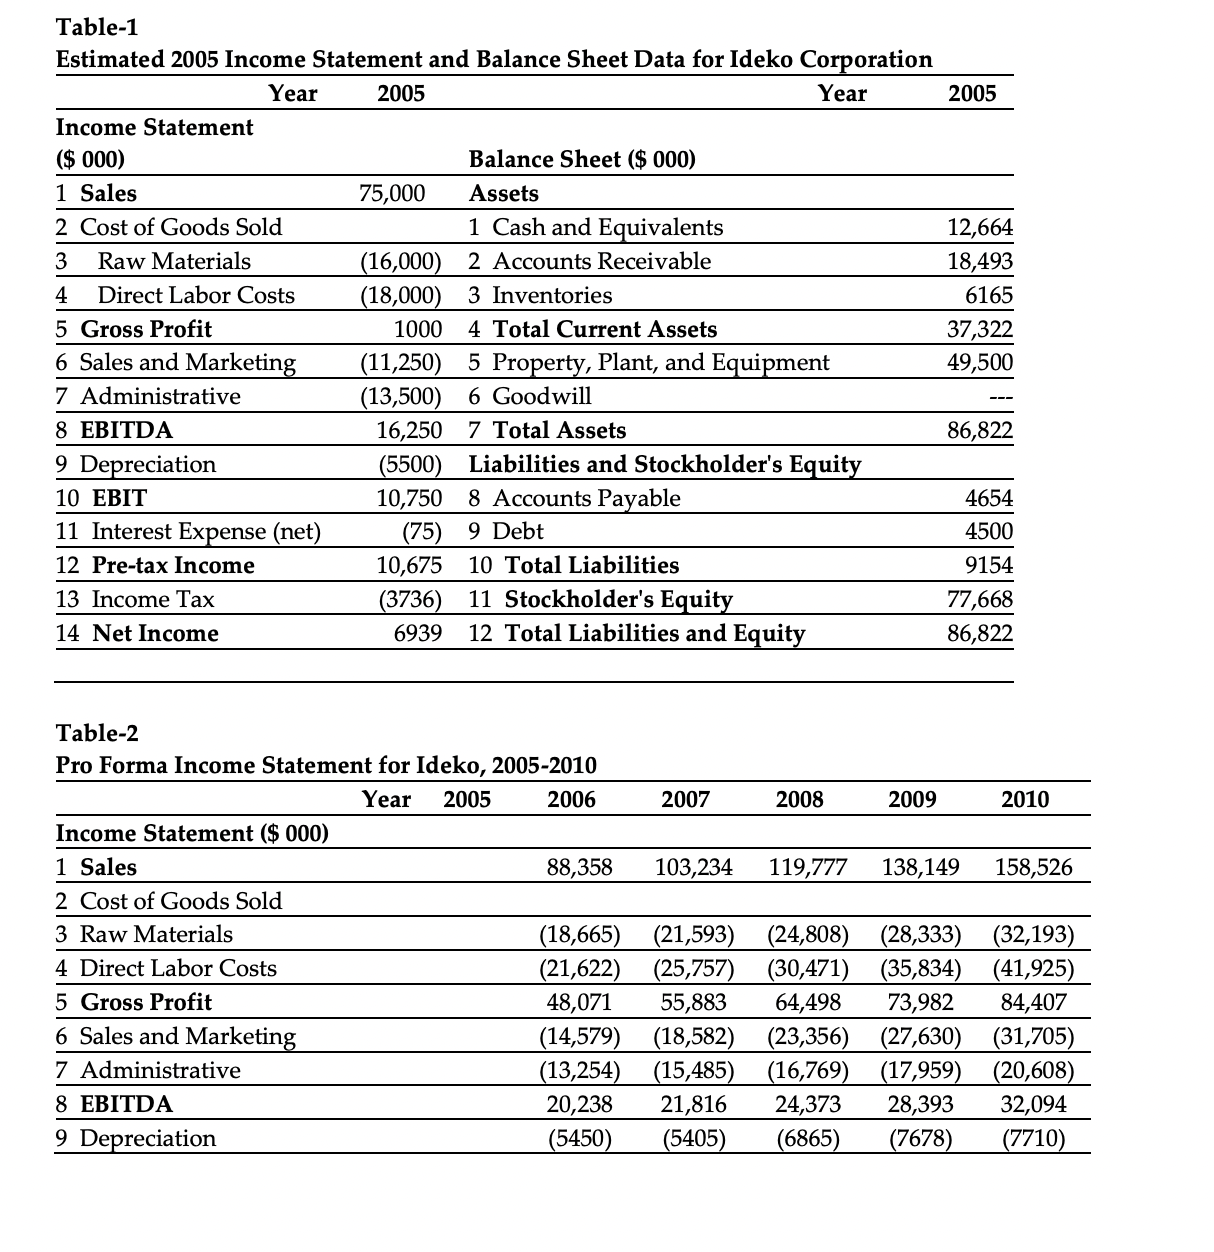
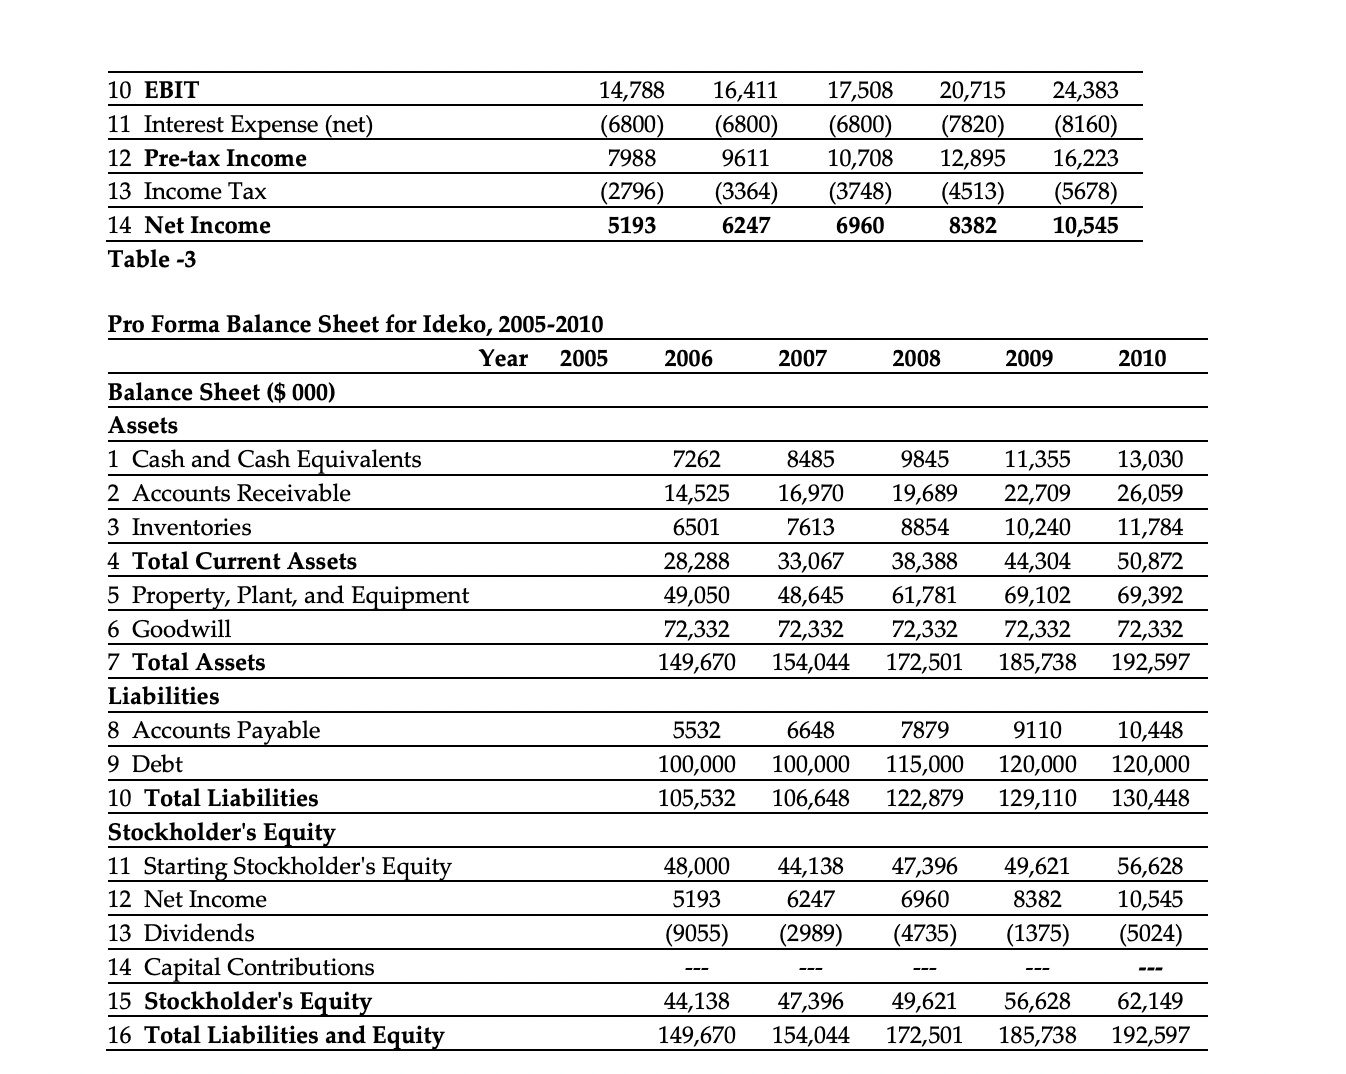
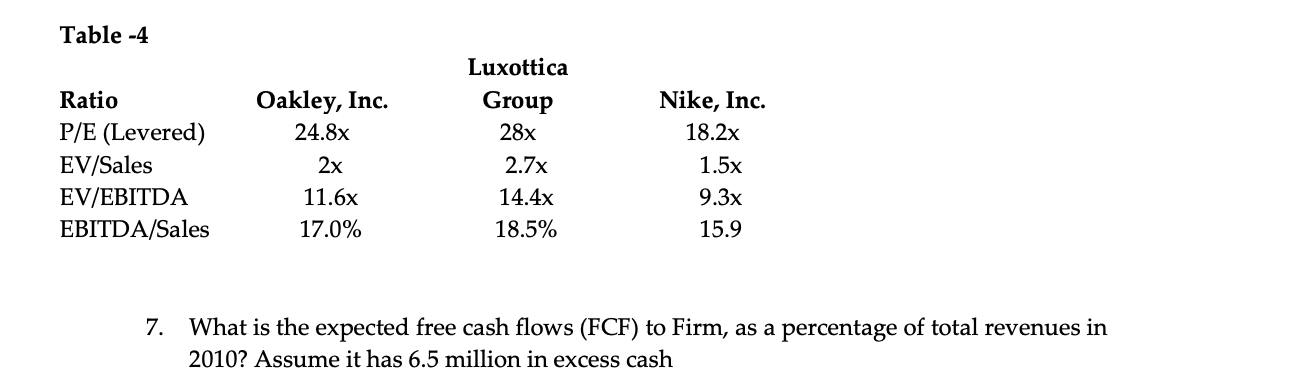
Table-1 Estimated 2005 Income Statement and Balance Sheet Data for Ideko Corporation Year 2005 Year 2005 Income Statement ($ 000) Balance Sheet ($ 000) 1 Sales 75,000 Assets 2 Cost of Goods Sold 1 Cash and Equivalents 2,664 Raw Materials 16,000) 2 Accounts Receivable 8,493 Direct Labor Costs 18,000) 3 Inventories 6165 Gross Profit 1000 4 Total Current Assets 37,322 6 Sales and Marketing (11,250) 5 Property, Plant, and Equipment 19,500 7 Administrative 13,500 6 Goodwill 8 EBITDA 16,250 7 Total Assets 36,822 9 Depreciation 5500) Liabilities and Stockholder's Equity 10 EBIT 10,750 8 Accounts Payable 4654 11 Interest Expense (net) 75 9 Debt 4500 12 Pre-tax Income 10,675 10 Total Liabilities 9154 13 Income Tax 3736) 11 Stockholder's Equity 77,668 14 Net Income 6939 12 Total Liabilities and Equity 36,822 Table-2 Pro Forma Income Statement for Ideko, 2005-2010 Year 2005 2006 2007 2008 2009 2010 Income Statement ($ 000) 1 Sales 38,358 103,234 119,777 138,149 158,526 2 Cost of Goods Sold 3 Raw Materials (18,665) (21,593) (24,808) (28,333 (32,193 4 Direct Labor Costs (21,622) (25,757) (30,471 (35,834 41,925) 5 Gross Profit 18,071 55,883 54,498 73,982 34,407 6 Sales and Marketing 14,579) (18,582) 23,356) (27,630 31,705) 7 Administrative 13,254 (15,485) (16,769) (17,959 (20,608) 8 EBITDA 20,238 21,816 24,373 28,393 32,094 9 Depreciation 5450) (5405) (6865 (7678) (7710)10 EBIT 14,788 16,411 17,508 20,715 24,383 11 Interest Expense (net) (6800) (6800 (6800 7820) (8160 12 Pre-tax Income 7988 9611 10,708 12,895 16,223 13 Income Tax (2796) (3364) (3748 4513 (5678) 14 Net Income 5193 6247 6960 8382 10,545 Table -3 Pro Forma Balance Sheet for Ideko, 2005-2010 Year 2005 2006 2007 2008 2009 2010 Balance Sheet ($ 000) Assets Cash and Cash Equivalents 7262 8485 9845 11,355 13,030 Accounts Receivable 14,525 16,970 19,689 22,709 26,059 3 Inventories 650 7613 8854 10,240 11,784 Total Current Assets 28,288 33,067 38,38 44,304 50,872 5 Property, Plant, and Equipment 49,050 48,645 61,781 69,102 69,392 6 Goodwill 72,332 72,332 72,332 72,332 72,332 Total Assets 149,670 154,044 172,501 185,738 192,597 Liabilities 8 Accounts Payable 5532 6648 7879 9110 10,448 9 Debt 100,000 100,000 115,000 120,000 120,000 10 Total Liabilities 105,532 106,648 122,879 129,110 130,448 Stockholder's Equity 11 Starting Stockholder's Equity 48,000 44,138 47,396 49,621 56,628 12 Net Income 5193 6247 6960 8382 10,545 13 Dividends 9055 2989 (4735) 1375) (5024) 14 Capital Contributions 15 Stockholder's Equity 44,138 47,396 49,621 56,628 62,149 16 Total Liabilities and Equity 149,670 154,044 172,501 185,738 192,597Table -4 Luxottica Ratio Oakley, Inc. Group Nike, Inc. P/E (Levered) 24.8x 28x 18.2x EV/Sales 2x 2.7x 1.5x EV/EBITDA 11.6x 14.4x 9.3x EBITDA/Sales 17.0% 18.5% 15.9 7. What is the expected free cash flows (FCF) to Firm, as a percentage of total revenues in 2010? Assume it has 6.5 million in excess cash
Step by Step Solution
There are 3 Steps involved in it
1 Expert Approved Answer
Step: 1 Unlock
Question Has Been Solved by an Expert!
Get step-by-step solutions from verified subject matter experts
Step: 2 Unlock
Step: 3 Unlock
Students Have Also Explored These Related Finance Questions!