

Question: Tableau Assignment #2 Read all instructions carefully before beginning. Tasks: 1. Connect to the Sample-Superstore data, and drag in the orders tab/table to get a
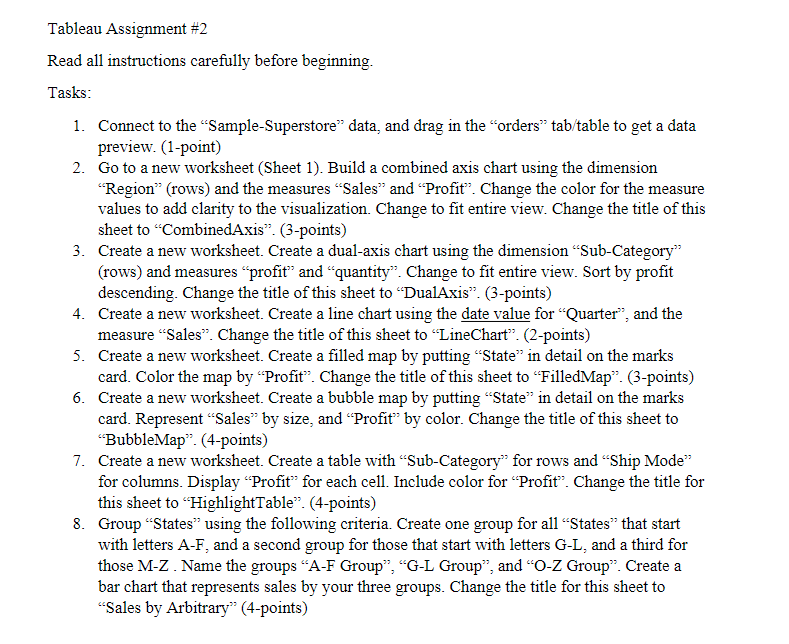
Tableau Assignment #2 Read all instructions carefully before beginning. Tasks: 1. Connect to the Sample-Superstore" data, and drag in the orders tab/table to get a data preview. (1-point) 2. Go to a new worksheet (Sheet 1). Build a combined axis chart using the dimension "Region" (rows) and the measures Sales and Profit. Change the color for the measure values to add clarity to the visualization. Change to fit entire view. Change the title of this sheet to "CombinedAxis". (3-points) 3. Create a new worksheet. Create a dual-axis chart using the dimension Sub-Category": (rows) and measures profit" and "quantity. Change to fit entire view. Sort by profit descending. Change the title of this sheet to DualAxis. (3-points) 4. Create a new worksheet. Create a line chart using the date value for "Quarter", and the measure Sales. Change the title of this sheet to "LineChart. (2-points) 5. Create a new worksheet. Create a filled map by putting State in detail on the marks card. Color the map by Profit. Change the title of this sheet to FilledMap". (3-points) 6. Create a new worksheet. Create a bubble map by putting State in detail on the marks card. Represent Sales by size, and Profit" by color. Change the title of this sheet to "BubbleMap. (4-points) 7. Create a new worksheet. Create a table with Sub-Category" for rows and "Ship Mode for columns. Display Profit for each cell. Include color for Profit". Change the title for this sheet to HighlightTable (4-points) 8. Group States using the following criteria. Create one group for all States that start with letters A-F, and a second group for those that start with letters G-L, and a third for those M-Z. Name the groups "A-F Group", "G-L Group", and "O-Z Group. Create a bar chart that represents sales by your three groups. Change the title for this sheet to Sales by Arbitrary" (4-points) Tableau Assignment #2 Read all instructions carefully before beginning. Tasks: 1. Connect to the Sample-Superstore" data, and drag in the orders tab/table to get a data preview. (1-point) 2. Go to a new worksheet (Sheet 1). Build a combined axis chart using the dimension "Region" (rows) and the measures Sales and Profit. Change the color for the measure values to add clarity to the visualization. Change to fit entire view. Change the title of this sheet to "CombinedAxis". (3-points) 3. Create a new worksheet. Create a dual-axis chart using the dimension Sub-Category": (rows) and measures profit" and "quantity. Change to fit entire view. Sort by profit descending. Change the title of this sheet to DualAxis. (3-points) 4. Create a new worksheet. Create a line chart using the date value for "Quarter", and the measure Sales. Change the title of this sheet to "LineChart. (2-points) 5. Create a new worksheet. Create a filled map by putting State in detail on the marks card. Color the map by Profit. Change the title of this sheet to FilledMap". (3-points) 6. Create a new worksheet. Create a bubble map by putting State in detail on the marks card. Represent Sales by size, and Profit" by color. Change the title of this sheet to "BubbleMap. (4-points) 7. Create a new worksheet. Create a table with Sub-Category" for rows and "Ship Mode for columns. Display Profit for each cell. Include color for Profit". Change the title for this sheet to HighlightTable (4-points) 8. Group States using the following criteria. Create one group for all States that start with letters A-F, and a second group for those that start with letters G-L, and a third for those M-Z. Name the groups "A-F Group", "G-L Group", and "O-Z Group. Create a bar chart that represents sales by your three groups. Change the title for this sheet to Sales by Arbitrary" (4-points)
Step by Step Solution
There are 3 Steps involved in it

Get step-by-step solutions from verified subject matter experts