

Question: Tableau DA 13-2: Exercise, Computing profit margin and return on assets LO P3 As consultants in advisory services, we are hired by Sayko Corporation to
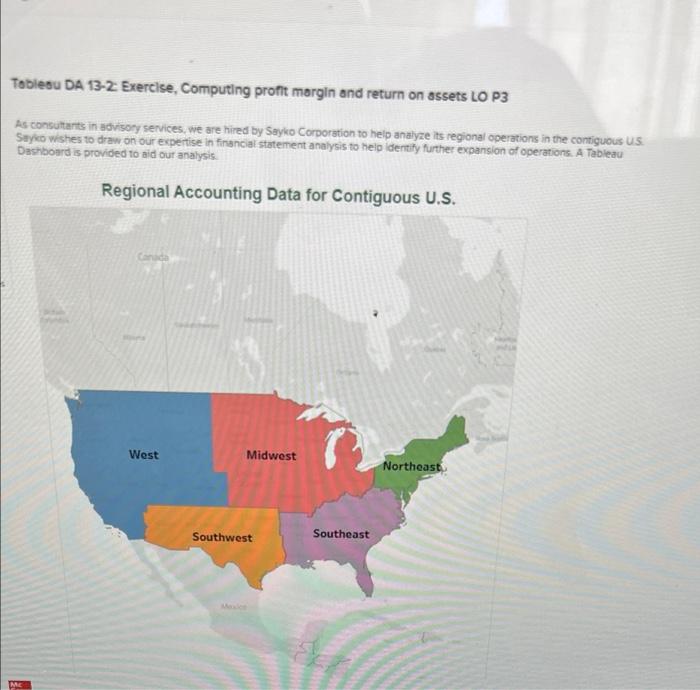
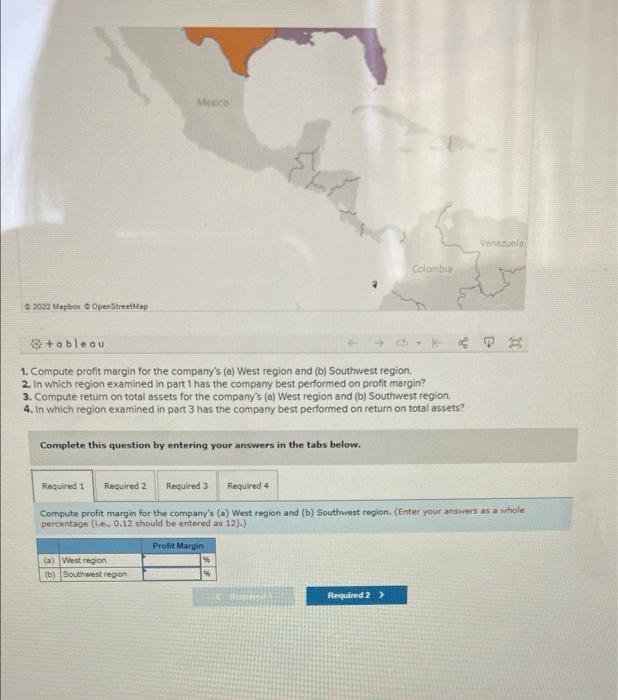
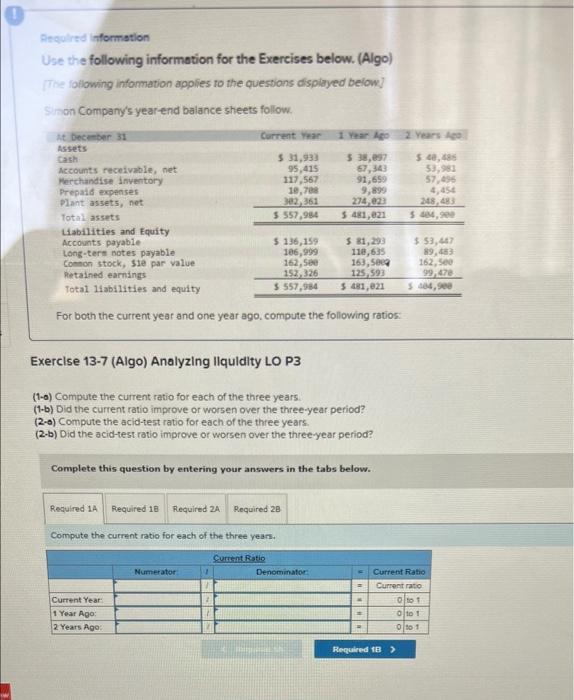
Tableau DA 13-2: Exercise, Computing profit margin and return on assets LO P3 As consultants in advisory services, we are hired by Sayko Corporation to help analyze its regional operations in the contiguous U.S. Sayko wishes to draw on our expertise in financial statement analysis to help identify further expansion of operations. A Tableau Dashboard is provided to aid our analysis. Regional Accounting Data for Contiguous U.S. Canada Midwest Northeast Mc West Southwest Southeast Mexico Venezuela Colombia 2022 Mapbox OpenStreetMap +obleau 1. Compute profit margin for the company's (a) West region and (b) Southwest region. 2. In which region examined in part 1 has the company best performed on profit margin? 3. Compute return on total assets for the company's (a) West region and (b) Southwest region. 4. In which region examined in part 3 has the company best performed on return on total assets? Complete this question by entering your answers in the tabs below. Required 1 Required 2 Required 3 Required 4 Compute profit margin for the company's (a) West region and (b) Southwest region. (Enter your answers as a whole percentage (ie. 0.12 should be entered as 12).) Profit Margin (a) West region (b) Southwest region Required 2 > Required information Use the following information for the Exercises below. (Algo) [The following information applies to the questions displayed below] Simon Company's year-end balance sheets follow. At December 31 Current Year Assets Cash $ 31,933 95,415 Accounts receivable, net 117,567 Merchandise inventory Prepaid expenses 10,708 302,361 Plant assets, net Total assets $ 557,984 Liabilities and Equity Accounts payable $ 136,159 Long-tere notes payable Common stock, sie par value 106,999 162,500 152,326 118,635 163,5009 Retained earnings 125,593 Total liabilities and equity $ 557,984 $ 481,021 For both the current year and one year ago, compute the following ratios: Exercise 13-7 (Algo) Analyzing liquidity LO P3 (1-0) Compute the current ratio for each of the three years. (1-b) Did the current ratio improve or worsen over the three-year period? (2-0) Compute the acid-test ratio for each of the three years. (2-b) Did the acid-test ratio improve or worsen over the three-year period? Complete this question by entering your answers in the tabs below. Required 1A Required 18 Required 2A Required 28 Compute the current ratio for each of the three years. Current Ratio Numerator Current Year: 1 Year Ago: 2 Years Ago: 1 Denominator: mengenal Sh 1 Year Ago 2 Years Ago $ 38,097 $ 40,486 67,343 53,981 91,659 57,496 9,899 274,023 4,454 248,483 $ 404,900 $ 481,021 $ 81,293 $ 53,447 89,483 162,500 99,478 $ 484,908 = . Current Ratio Current ratio 10 to 1 010 1 0 to 1 = Required 18 >
Step by Step Solution
There are 3 Steps involved in it

Get step-by-step solutions from verified subject matter experts