

Question: Tableau Dashboard Activity 10-1: Bond Returns The following Tableau dashboard visualization represents a periodic table of bond returns for several different bond types. The far-
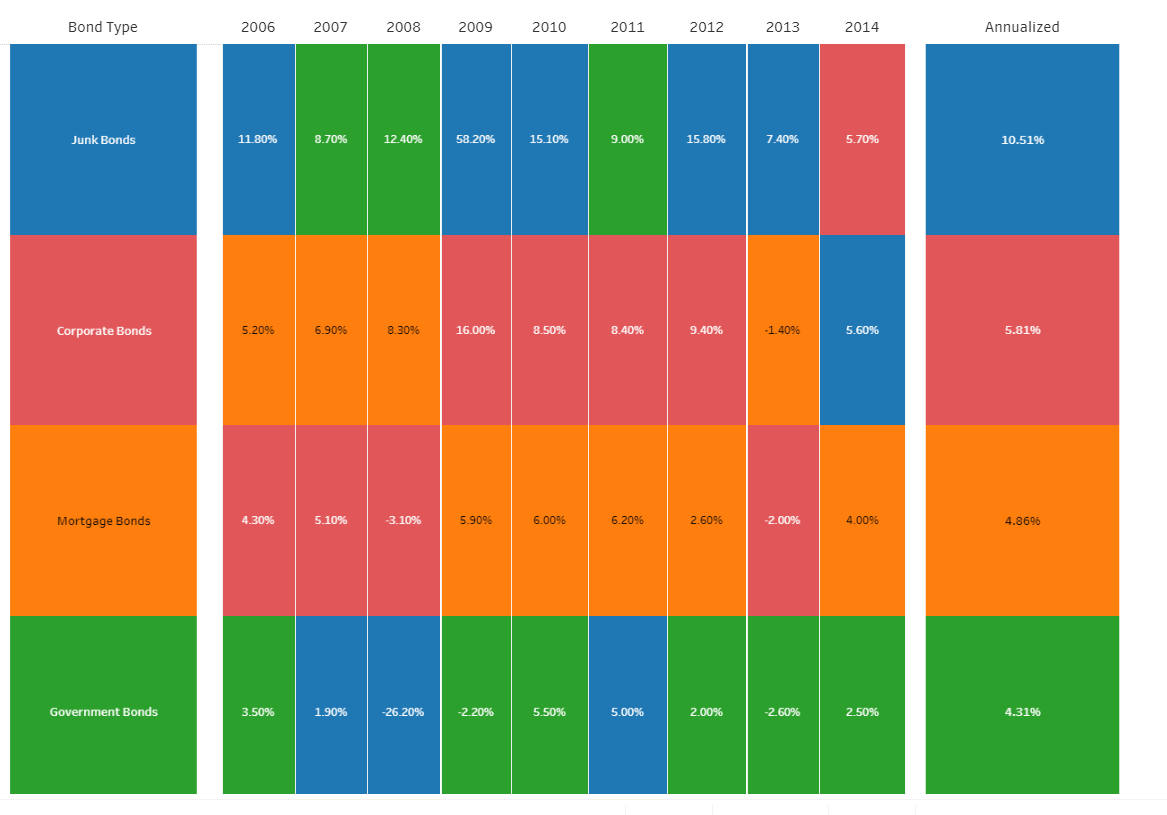
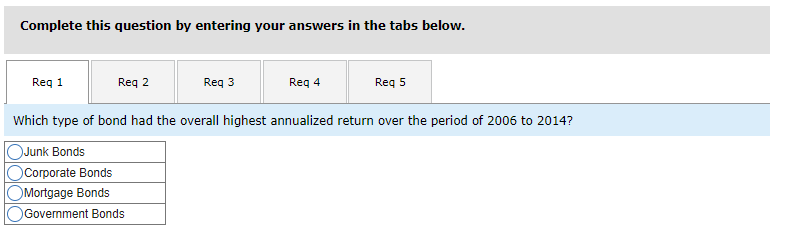
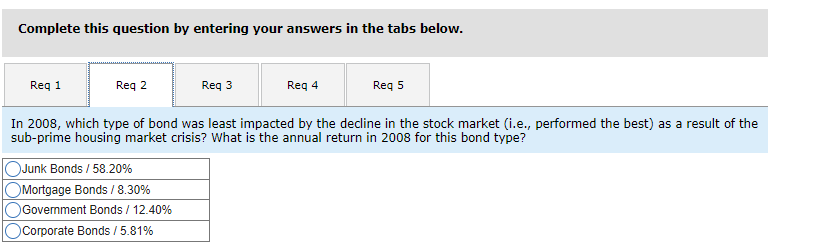
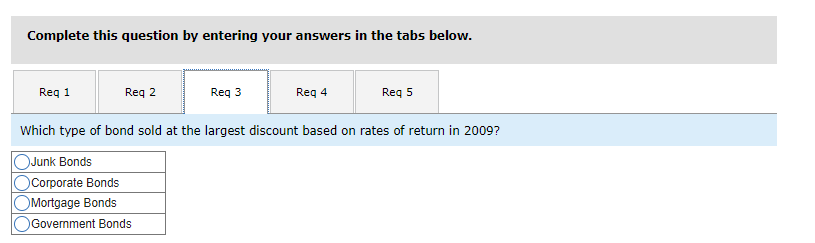
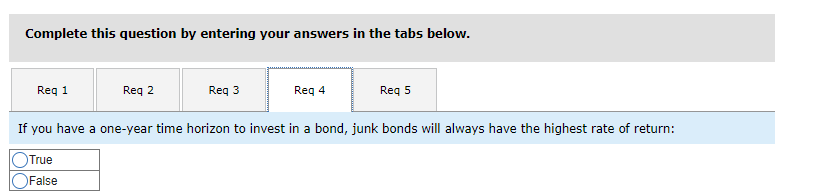
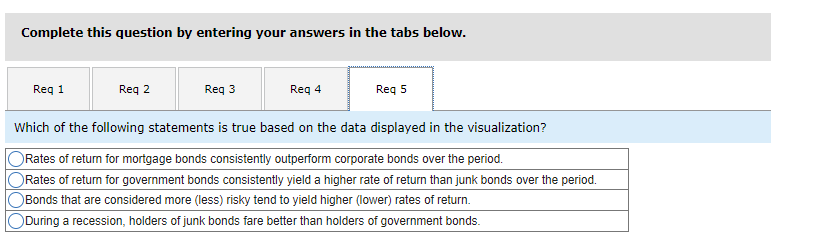
Tableau Dashboard Activity 10-1: Bond Returns The following Tableau dashboard visualization represents a "periodic table" of bond returns for several different bond types. The far- left column represents the color key for each bond type, ranked in order of annualized returns (far-right column) during the period of 2006 to 2014. The columns in the middle show the annual return each year for all bond types as indicated in the color key. For example, in 2006, we can see that mortgage bonds (colored orange) had a return of 5.20%, and the overall return on mortgage bonds for the entire period was 4.86% (shown in the far-right column). To assist you in better understanding this visualization, each bond type is defined as follows: Junk Bonds - These are bonds normally issued by companies with a risk of default. For this reason, they are considered high risk, with the trade-off being that they normally promise higher returns than other types of bonds. Corporate Bonds - These are bonds issued by corporations that are in a good financial condition, meaning they are likely able to fulfill their debt obligation. As such, these bonds are considered lower risk, but also come with a lower rate of return than junk bonds ws Mortgage Bonds - These are bonds that are backed by holdings in real estate, meaning that in the event of default, the property could be sold to cover the cost of the bond. Government Bonds - These are bonds issued by the government. They are considered the lowest risk because there is a minimal likelihood that the government would not be able to fulfill its debt obligation. As such, these bonds often carry lower rates of return than other types of bonds. Now that you have a better understanding of the visualization, answer the following questions about the data and what it shows about these different bond types. Bond Type 2006 2007 2008 2009 2010 2011 2012 2013 2014 Annualized Junk Bonds 11.80% 8.70% 12.40% 58.20% 15.10% 9.00% 15.80% 7.40% 5.70% 10.5196 Corporate Bonds 5.2096 6.9096 8.30% % 16.00% 8.50% % 8.40% 9.40% -1.40% 5.60% 5.8196 Mortgage Bonds 4.30% 5.10% -3.10% % 5.9096 6.0096 6.20% 2.6096 -2.00% 4.0096 4.8696 Government Bonds 3.50% 1.90% -26.20% % -2.20% 5.50% 5.00% 2.00% -2.609 % 2.50% 4.3196 Complete this question by entering your answers in the tabs below. Reg 1 Req 2 Reg 3 Reg 4 Req 5 Which type of bond had the overall highest annualized return over the period of 2006 to 2014? O Junk Bonds Corporate Bonds O Mortgage Bonds O Government Bonds Complete this question by entering your answers in the tabs below. Reg 1 Reg 2 Reg 3 Req 4 Reg 5 In 2008, which type of bond was least impacted by the decline in the stock market (i.e., performed the best) as a result of the sub-prime housing market crisis? What is the annual return in 2008 for this bond type? Junk Bonds / 58.20% Mortgage Bonds / 8.30% O Government Bonds / 12.40% Corporate Bonds /5.81% Complete this question by entering your answers in the tabs below. Reg 1 Req 2 Reg 3 Reg 4 Req 5 Which type of bond sold at the largest discount based on rates of return in 2009? Junk Bonds Corporate Bonds Mortgage Bonds Government Bonds Complete this question by entering your answers in the tabs below. Reg 1 Reg 2 Req3 Req 4 Reg 5 If you have a one-year time horizon to invest in a bond, junk bonds will always have the highest rate of return: True False Complete this question by entering your answers in the tabs below. Reg 1 Reg 2 Req3 Req 4 Reg 5 Which of the following statements is true based on the data displayed in the visualization? Rates of return for mortgage bonds consistently outperform corporate bonds over the period. Rates of return for government bonds consistently yield a higher rate of return than junk bonds over the period. Bonds that are considered more (less) risky tend to yield higher (lower) rates of return. During a recession, holders of junk bonds fare better than holders of government bonds. Tableau Dashboard Activity 10-1: Bond Returns The following Tableau dashboard visualization represents a "periodic table" of bond returns for several different bond types. The far- left column represents the color key for each bond type, ranked in order of annualized returns (far-right column) during the period of 2006 to 2014. The columns in the middle show the annual return each year for all bond types as indicated in the color key. For example, in 2006, we can see that mortgage bonds (colored orange) had a return of 5.20%, and the overall return on mortgage bonds for the entire period was 4.86% (shown in the far-right column). To assist you in better understanding this visualization, each bond type is defined as follows: Junk Bonds - These are bonds normally issued by companies with a risk of default. For this reason, they are considered high risk, with the trade-off being that they normally promise higher returns than other types of bonds. Corporate Bonds - These are bonds issued by corporations that are in a good financial condition, meaning they are likely able to fulfill their debt obligation. As such, these bonds are considered lower risk, but also come with a lower rate of return than junk bonds ws Mortgage Bonds - These are bonds that are backed by holdings in real estate, meaning that in the event of default, the property could be sold to cover the cost of the bond. Government Bonds - These are bonds issued by the government. They are considered the lowest risk because there is a minimal likelihood that the government would not be able to fulfill its debt obligation. As such, these bonds often carry lower rates of return than other types of bonds. Now that you have a better understanding of the visualization, answer the following questions about the data and what it shows about these different bond types. Bond Type 2006 2007 2008 2009 2010 2011 2012 2013 2014 Annualized Junk Bonds 11.80% 8.70% 12.40% 58.20% 15.10% 9.00% 15.80% 7.40% 5.70% 10.5196 Corporate Bonds 5.2096 6.9096 8.30% % 16.00% 8.50% % 8.40% 9.40% -1.40% 5.60% 5.8196 Mortgage Bonds 4.30% 5.10% -3.10% % 5.9096 6.0096 6.20% 2.6096 -2.00% 4.0096 4.8696 Government Bonds 3.50% 1.90% -26.20% % -2.20% 5.50% 5.00% 2.00% -2.609 % 2.50% 4.3196 Complete this question by entering your answers in the tabs below. Reg 1 Req 2 Reg 3 Reg 4 Req 5 Which type of bond had the overall highest annualized return over the period of 2006 to 2014? O Junk Bonds Corporate Bonds O Mortgage Bonds O Government Bonds Complete this question by entering your answers in the tabs below. Reg 1 Reg 2 Reg 3 Req 4 Reg 5 In 2008, which type of bond was least impacted by the decline in the stock market (i.e., performed the best) as a result of the sub-prime housing market crisis? What is the annual return in 2008 for this bond type? Junk Bonds / 58.20% Mortgage Bonds / 8.30% O Government Bonds / 12.40% Corporate Bonds /5.81% Complete this question by entering your answers in the tabs below. Reg 1 Req 2 Reg 3 Reg 4 Req 5 Which type of bond sold at the largest discount based on rates of return in 2009? Junk Bonds Corporate Bonds Mortgage Bonds Government Bonds Complete this question by entering your answers in the tabs below. Reg 1 Reg 2 Req3 Req 4 Reg 5 If you have a one-year time horizon to invest in a bond, junk bonds will always have the highest rate of return: True False Complete this question by entering your answers in the tabs below. Reg 1 Reg 2 Req3 Req 4 Reg 5 Which of the following statements is true based on the data displayed in the visualization? Rates of return for mortgage bonds consistently outperform corporate bonds over the period. Rates of return for government bonds consistently yield a higher rate of return than junk bonds over the period. Bonds that are considered more (less) risky tend to yield higher (lower) rates of return. During a recession, holders of junk bonds fare better than holders of government bonds
Step by Step Solution
There are 3 Steps involved in it

Get step-by-step solutions from verified subject matter experts