

Question: Tableau Dashboard Activity 7-1 Part 2 Assume that you work inside TSS's accounting department, and can access the above totals as well as financial data
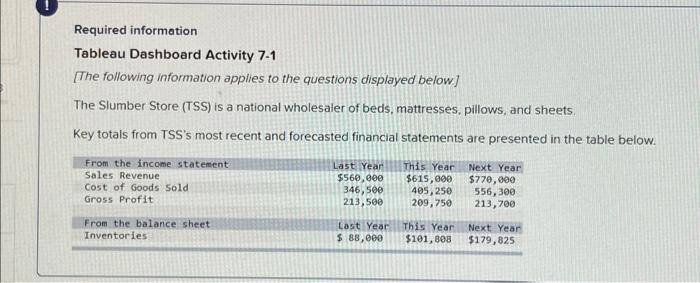
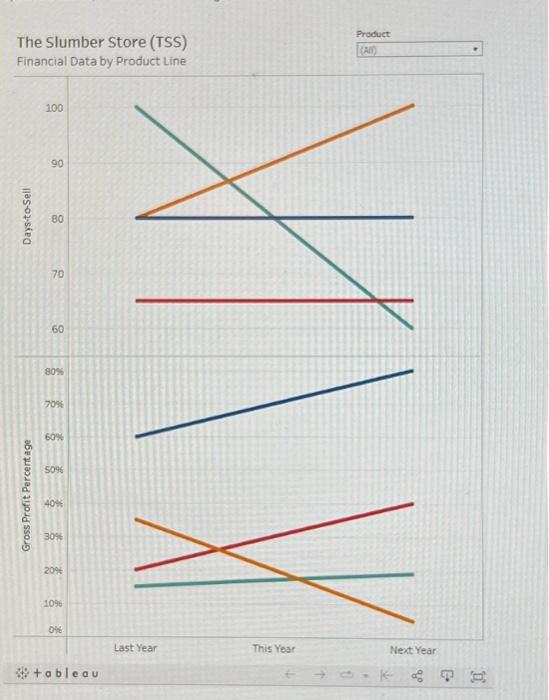
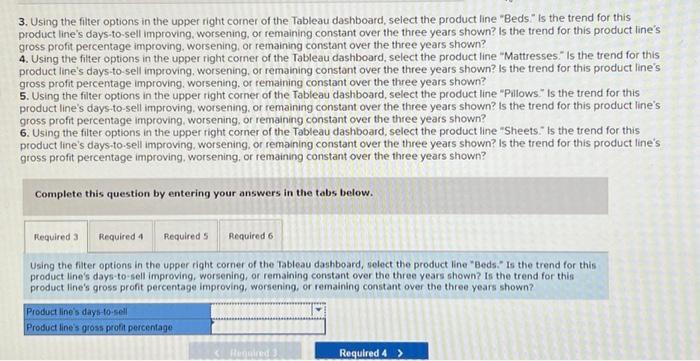
Tableau Dashboard Activity 7-1 Part 2 Assume that you work inside TSS's accounting department, and can access the above totals as well as financial data by product line Use the Tableau dashboard below, which will allow you to use the filter options in the upper-right corner of the dashboard to reveal specific amounts, to answer the following questions. The Slumber Store (TSS) Financial Data by Product Line Product: 34+obleau Required information Tableau Dashboard Activity 7-1 [The following information applies to the questions displayed below] The Slumber Store (TSS) is a national wholesaier of beds, mattresses, pillows, and sheets. Key totals from TSS's most recent and forecasted financial statements are presented in the table below. 3. Using the filter options in the upper right corner of the Tableau dashboard, select the product line "Beds" Is the trend for this product line's days-to-sell improving, worsening, or remaining constant over the three years shown? Is the trend for this product line's gross profit percentage improving, worsening, or remaining constant over the three years shown? 4. Using the fitter options in the upper right corner of the Tableau dashboard, select the product line "Mattresses. Is the trend for this product line's days-to-sell improving, worsening, or remaining constant over the three years shown? Is the trend for this product line's gross profit percentage improving, worsening. or remaining constant over the three years shown? 5. Using the filter options in the upper right corner of the Tableau dashboard, select the product line "Pillows" Is the trend for this product line's days-to-sell improving. worsening, or remaining constant over the three years shown? is the trend for this product line's gross profit percentage improving, worsening, or remaining constant over the three years shown? 6. Using the filter options in the upper right corner of the Tableau dashboard, select the product line "Sheets. " Is the trend for this product line's days-to-sell improving, worsening. or remaining constant over the three years shown? is the trend for this product line's gross profit percentage improving. worsening, or remaining constant over the three years shown? Complete this question by entering your answers in the tabs below. Using the fiter options in the upper right corner of the Tableau dashboard, select the product line "Beds." Is the trend for this product line's days-to-sell improving, worsening, or remaining constant over the three years shown? Is the trend for this product line's gross profit percentage improving, worsening. or remaining constant over the three years shown
Step by Step Solution
There are 3 Steps involved in it

Get step-by-step solutions from verified subject matter experts