

Question: Tableau Instructions: You have available to you an extensive data set that includes detailed financial data for Discount Goods and Big Store and for 2012-
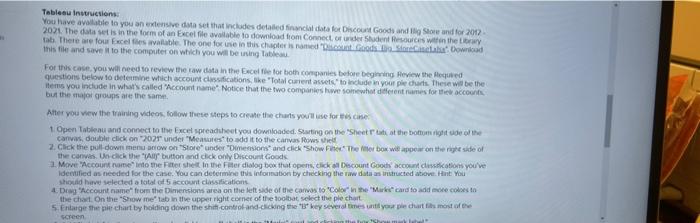
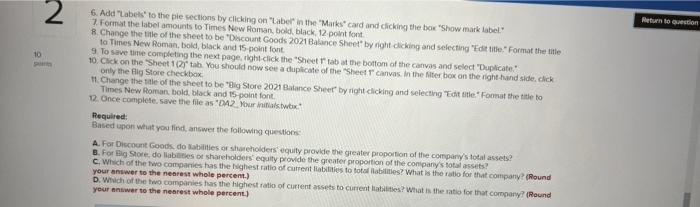
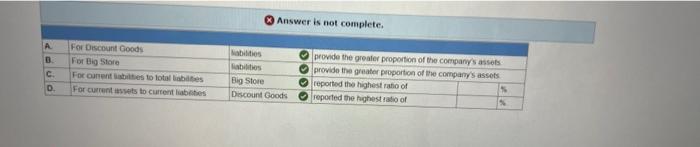
Tableau Instructions: You have available to you an extensive data set that includes detailed financial data for Discount Goods and Big Store and for 2012- 2021. The data set is in the form of an Excel file available to download from Connect, or under Student Resources within the Library tab. There are four Excel files available. The one for use in this chapter is named "Discount Goods this file and save it to the computer on which you will be using Tableau StoreCaselaba Download For this case, you will need to review the raw data in the Excel file for both companies before beginning Review the Requed questions below to determine which account classifications, like "Total current assets to include in your ple charts. These will be the c items you include in what's called "Account name" Notice that the two companies have somewhat different names for the accounts but the major groups are the same. After you view the training videos, follow these steps to create the charts you'll use for this case 1. Open Tableau and connect to the Excel spreadsheet you downloaded. Starting on the "Sheet r tats at the bottom right side of the canvas, double click on "2021 under "Measures to add it to the canvas Rows shelf 2. Click the pull-down menu arrow on "Store" under "Dimensions and click "Show Fiber The fer box will appear on the right side of the canvas. Un-click the "Ally" button and click only Discount Goods 3. Move Account name into the Fifter shell in the Fiter dialog box that opens, click all Discount Goods account classifications you've Identified as needed for the case. You can determine this information by checking the raw data as instructed above. Hat You should have selected a total of 5 account classifications 4. Drag "Account name" from the Dimensions area on the left side of the canvas to "Color" in the "Marks" card to add more colors to the chart. On the "Show me" tab in the upper right corner of the toolbat select the pile chart 5. Enlarge the pie chart by holding down the shift-control-and-clicking the "B" key several times until your ple chart fits most of the screen how mack label 10 2 6. Add "Labels to the pie sections by clicking on "Label" in the "Marks" card and clicking the box "Show mark label" 7. Format the label amounts to Times New Roman, bold, black, 12-point font 8. Change the title of the sheet to be "Discount Goods 2021 Balance Sheet" by right clicking and selecting "Edit title." Format the title to Times New Roman, bold, black and 15-point font 9. To save time completing the next page, right click the "Sheet T tab at the bottom of the canvas and select "Duplicate." 10. Click on the Sheet 1(2)" tab. You should now see a duplicate of the "Sheet T canvas. In the filter box on the right hand side, click only the Big Store checkbox 11. Change the title of the sheet to be "Big Store 2021 Balance Sheet" by right clicking and selecting Edit title" Format the title to Times New Roman, bold, black and 15-point font 12. Once complete, save the file as "DA2 Your initials bbx Required: Based upon what you find, answer the following questions: A. For Discount Goods, do labilities or shareholders equity provide the greater proportion of the company's total assets? B. For Big Store, do liabilities or shareholders equity provide the greater proportion of the company's total assets? C. Which of the two companies has the highest ratio of current liabilities to total abilities? What is the ratio for that company? (Round your answer to the nearest whole percent) D. Which of the two companies has the highest ratio of current assets to current liabilities? What is the ratio for that company? (Round your answer to the nearest whole percent) Return to question A B C. D. For Discount Goods For Big Store For current abilities to total liabilites For current assets to current liabilities Answer is not complete. Nabilities abilities Big Store Discount Goods provide the greater proportion of the company's assets provide the greater proportion of the company's assets reported the highest ratio of Oreported the highest ratio of % % Tableau Instructions: You have available to you an extensive data set that includes detailed financial data for Discount Goods and Big Store and for 2012- 2021. The data set is in the form of an Excel file available to download from Connect, or under Student Resources within the Library tab. There are four Excel files available. The one for use in this chapter is named "Discount Goods this file and save it to the computer on which you will be using Tableau StoreCaselaba Download For this case, you will need to review the raw data in the Excel file for both companies before beginning Review the Requed questions below to determine which account classifications, like "Total current assets to include in your ple charts. These will be the c items you include in what's called "Account name" Notice that the two companies have somewhat different names for the accounts but the major groups are the same. After you view the training videos, follow these steps to create the charts you'll use for this case 1. Open Tableau and connect to the Excel spreadsheet you downloaded. Starting on the "Sheet r tats at the bottom right side of the canvas, double click on "2021 under "Measures to add it to the canvas Rows shelf 2. Click the pull-down menu arrow on "Store" under "Dimensions and click "Show Fiber The fer box will appear on the right side of the canvas. Un-click the "Ally" button and click only Discount Goods 3. Move Account name into the Fifter shell in the Fiter dialog box that opens, click all Discount Goods account classifications you've Identified as needed for the case. You can determine this information by checking the raw data as instructed above. Hat You should have selected a total of 5 account classifications 4. Drag "Account name" from the Dimensions area on the left side of the canvas to "Color" in the "Marks" card to add more colors to the chart. On the "Show me" tab in the upper right corner of the toolbat select the pile chart 5. Enlarge the pie chart by holding down the shift-control-and-clicking the "B" key several times until your ple chart fits most of the screen how mack label 10 2 6. Add "Labels to the pie sections by clicking on "Label" in the "Marks" card and clicking the box "Show mark label" 7. Format the label amounts to Times New Roman, bold, black, 12-point font 8. Change the title of the sheet to be "Discount Goods 2021 Balance Sheet" by right clicking and selecting "Edit title." Format the title to Times New Roman, bold, black and 15-point font 9. To save time completing the next page, right click the "Sheet T tab at the bottom of the canvas and select "Duplicate." 10. Click on the Sheet 1(2)" tab. You should now see a duplicate of the "Sheet T canvas. In the filter box on the right hand side, click only the Big Store checkbox 11. Change the title of the sheet to be "Big Store 2021 Balance Sheet" by right clicking and selecting Edit title" Format the title to Times New Roman, bold, black and 15-point font 12. Once complete, save the file as "DA2 Your initials bbx Required: Based upon what you find, answer the following questions: A. For Discount Goods, do labilities or shareholders equity provide the greater proportion of the company's total assets? B. For Big Store, do liabilities or shareholders equity provide the greater proportion of the company's total assets? C. Which of the two companies has the highest ratio of current liabilities to total abilities? What is the ratio for that company? (Round your answer to the nearest whole percent) D. Which of the two companies has the highest ratio of current assets to current liabilities? What is the ratio for that company? (Round your answer to the nearest whole percent) Return to question A B C. D. For Discount Goods For Big Store For current abilities to total liabilites For current assets to current liabilities Answer is not complete. Nabilities abilities Big Store Discount Goods provide the greater proportion of the company's assets provide the greater proportion of the company's assets reported the highest ratio of Oreported the highest ratio of % %
Step by Step Solution
There are 3 Steps involved in it

Get step-by-step solutions from verified subject matter experts