

Question: TABLEAU PROJECT I need help in question #2: Please provide instructions to how to answer the question. It should have labels that show sales organization
TABLEAU PROJECT
I need help in question #2:
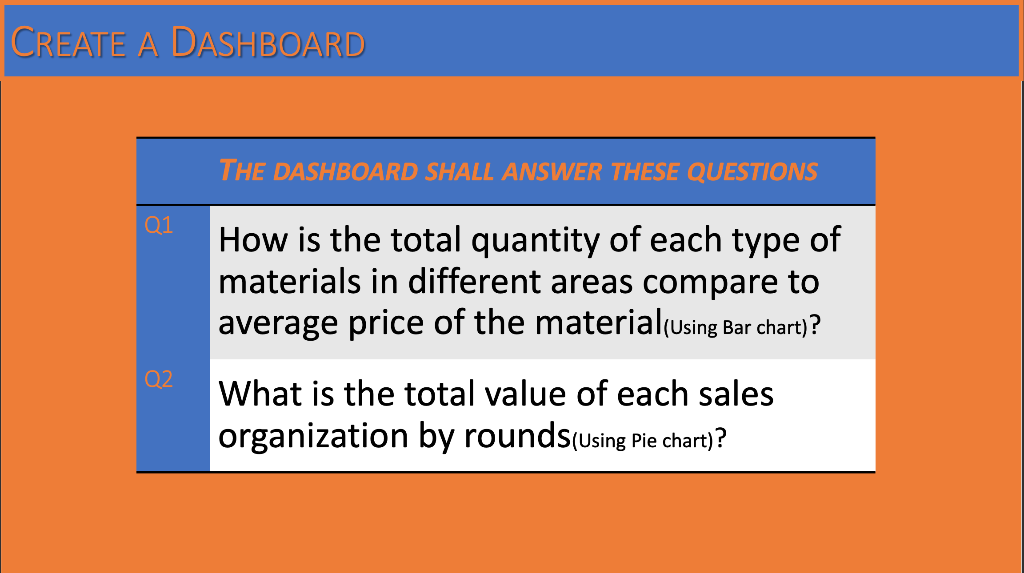
Please provide instructions to how to answer the question. It should have labels that show sales organization names and total sales values. The chart should use the round as the filter. Different organizations should be in different colors.
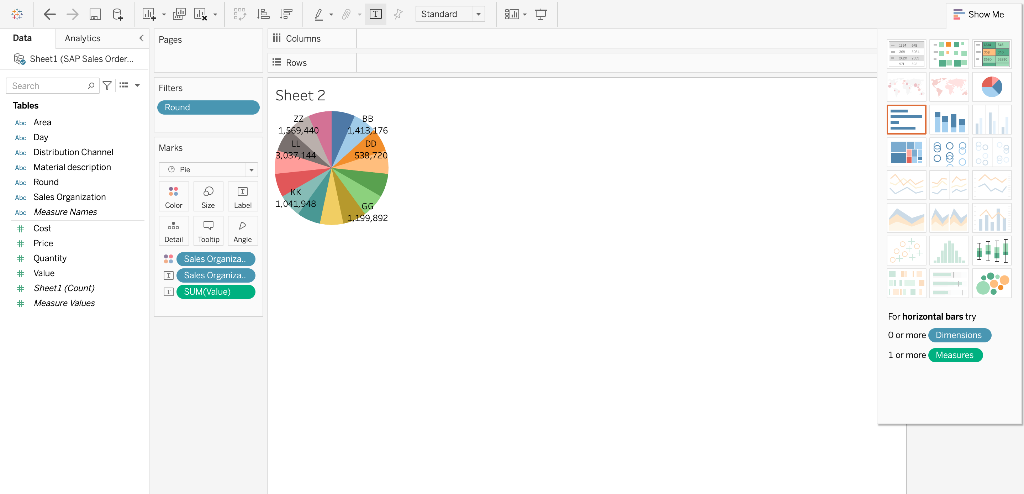
In my sheet, I dragged "Round" to Filters, dragged "Sales Organization" to Color, dragged "Sales Organization" to Label, and dragged "Value" to Label. I am not sure if this is the correct way to answer the question. Please help me! I feel that my Pie Chart is very wrong.
Step by Step Solution
There are 3 Steps involved in it
1 Expert Approved Answer
Step: 1 Unlock

Question Has Been Solved by an Expert!
Get step-by-step solutions from verified subject matter experts
Step: 2 Unlock
Step: 3 Unlock