

Question: tables are just in case you need them! please answer all parts and square answer thank you thank you Required information [The following information applies
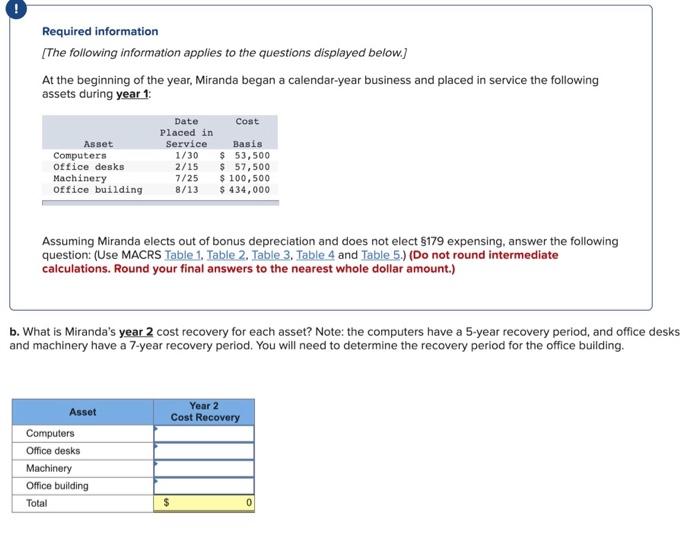
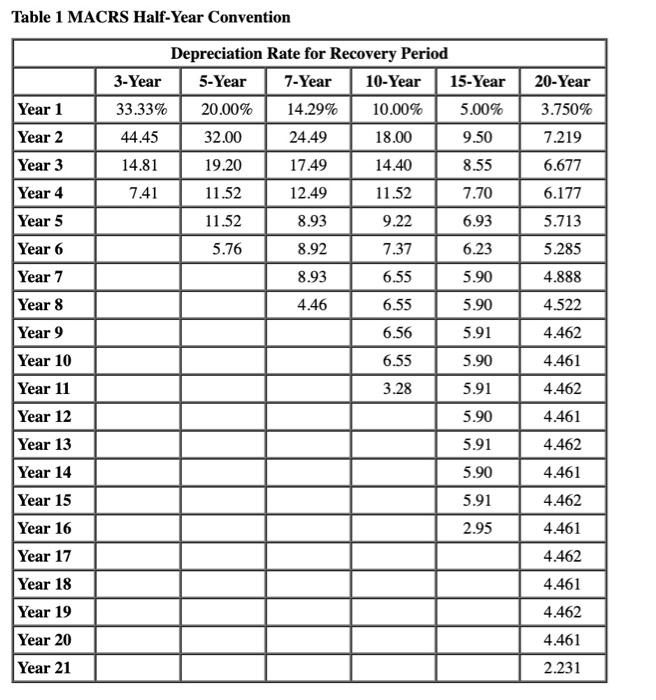
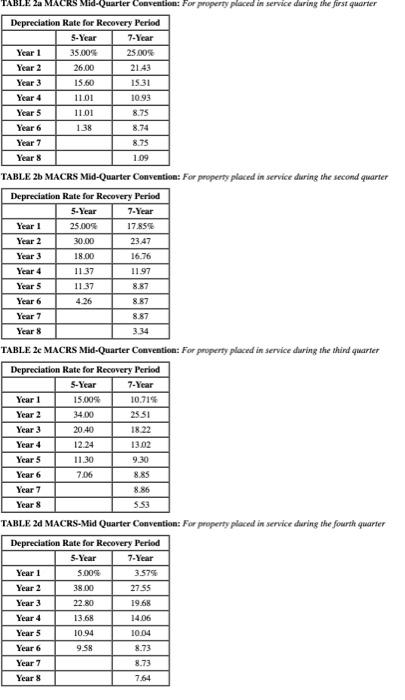
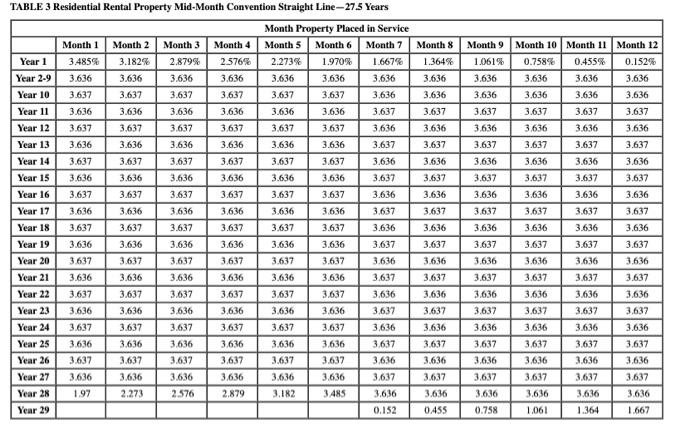
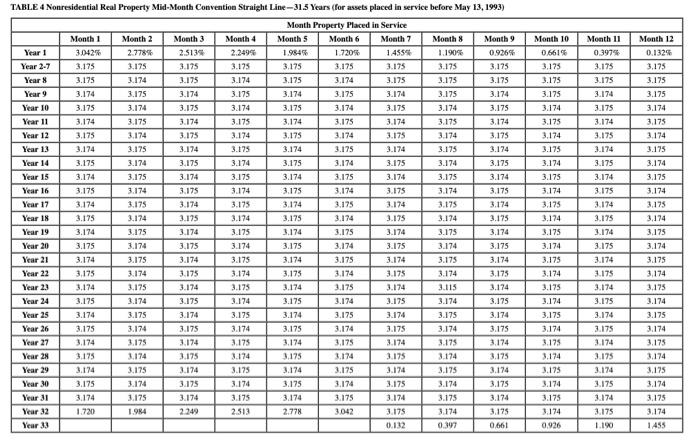
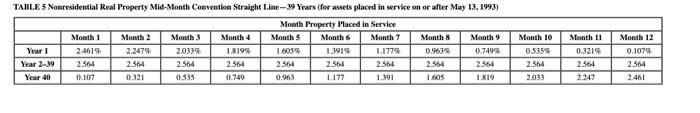
Required information [The following information applies to the questions displayed below.) At the beginning of the year, Miranda began a calendar-year business and placed in service the following assets during year 1: Asset Computers Office desks Machinery Office building Date Cost Placed in Service Basis 1/30 $ 53,500 2/15 $ 57,500 7/25 $ 100, 500 8/13 $ 434,000 Assuming Miranda elects out of bonus depreciation and does not elect $179 expensing, answer the following question: (Use MACRS Table 1. Table 2. Table 3. Table 4 and Table 5.) (Do not round intermediate calculations. Round your final answers to the nearest whole dollar amount.) b. What is Miranda's year 2 cost recovery for each asset? Note: the computers have a 5-year recovery period, and office desks and machinery have a 7-year recovery period. You will need to determine the recovery period for the office building. Year 2 Cost Recovery Asset Computers Office desks Machinery Office building Total $ 0 Table 1 MACRS Half-Year Convention 20-Year 3.750% Depreciation Rate for Recovery Period 3-Year 5-Year 7-Year 10-Year 15-Year 33.33% 20.00% 14.29% 10.00% 5.00% 44.45 32.00 24.49 18.00 9.50 14.81 19.20 17.49 14.40 8.55 7.41 11.52 12.49 11.52 7.70 11.52 8.93 9.22 6.93 7.219 6.677 6.177 5.713 5.285 4.888 5.76 8.92 7.37 6.23 8.93 6.55 5.90 4.46 6.55 5.90 4.522 6.56 5.91 4.462 6.55 5.90 Year 1 Year 2 Year 3 Year 4 Year 5 Year 6 Year 7 Year 8 Year 9 Year 10 Year 11 Year 12 Year 13 Year 14 Year 15 Year 16 Year 17 Year 18 Year 19 Year 20 Year 21 4.461 4.462 3.28 5.91 4.461 5.90 5.91 4.462 5.90 5.91 2.95 4.461 4.462 4.461 4.462 4.461 4.462 4.461 2.231 TABLE 2a MACRS Mid-Quarter Convention: For property placed in service during the first quarter Depreciation Rate for Recovery Period 5-Year 7-Year Year 1 35.00% 25.00% Year 2 26.00 21.43 Year 3 15.60 15.31 Year 4 11.01 10.93 Year 5 11.01 8.75 Year 6 1.38 8.74 Year 7 8.75 Year 8 1.09 TABLE 26 MACRS Mid-Quarter Convention: For property placed in service during the second quarter Depreciation Rate for Recovery Period 5-Year 7-Year Year 1 25.00% 17.85% Year 2 30.00 23.47 Year 3 18.00 16.76 Year 4 1137 11.97 Year 5 1137 Year 6 4.26 8.87 Year 7 8.87 Year 8 3.34 TABLE 26 MACRS Mid-Quarter Convention: For property placed in service during the third quarter Depreciation Rate for Recovery Period 5-Year 7-Year Year 1 15.00% 10.71% Year 2 34.00 2551 Year 2 20.40 18.22 Year 4 12.24 13.02 Year 5 9.30 Year 6 7.06 8.85 Year 7 8.86 Year 8 5.53 TABLE 20 MACRS-Mid Quarter Convention: For property placed in service during the fourth quarter Depreciation Rate for Recovery Period 5-Year 7-Year Year 1 5.00 3.575 Year 2 38.00 27.55 Year 3 22.80 19.68 Year 4 13.68 14.06 11.30 Year 5 10.94 10.04 9. SR 8.73 Year 6 Year 7 Year 8 8.73 7.64 Month 8 1.364% Month 9 1.061% 3.636 3.636 3.636 3.637 3.636 3.637 3.636 3.637 3.636 3.637 3.636 3.637 TABLE 3 Residential Rental Property Mid-Month Convention Straight Line-27.5 Years Month Property Placed in Service Month 1 Month 2 Month 3 Month 4 Month 5 Month 6 Month 7 Year 1 3.4856 3.182 2.879% 2.576% 2.273% 1.970% 1.667% Year 2.9 3.636 3.636 3.636 3.636 3.636 3.636 3.636 Year 10 3.637 3.637 3.637 3.637 3.637 3.637 3,636 Year 11 3.636 3.636 3.636 3.636 3.636 3.636 3.637 Year 12 3.637 3.637 3.637 3,637 3.637 3.637 3.636 Year 13 3.636 3.636 3.636 3.636 3.636 3.636 3,637 Year 14 3.637 3.637 3.637 3.637 3.637 3.637 3.636 Year 15 3.636 3.636 3.636 3.636 3.636 3.636 3.637 Year 16 3.637 3.637 3.637 3.637 3.637 3.637 3.636 Year 17 3.636 3.636 3.636 3,636 3.636 3.636 3.637 Year 18 3.637 3.637 3.637 3.637 3.637 3.637 3.636 Year 19 3.636 3.636 3.636 3.636 3.636 3.636 3.637 Year 20 3.637 3.637 3.637 3.637 3.637 3.637 3.636 Year 21 3.636 3.636 3.636 3.636 3.636 3.636 3637 Year 22 3.637 3.637 3,637 3.637 3.637 3.637 3.636 Year 23 3.636 3.636 3,636 3.636 3.636 3.636 3.637 Year 24 3.637 3.637 3.637 3,637 3.637 3.637 3,636 Year 25 3.636 3.636 3.636 3.636 3.636 3.636 3,637 Year 26 3.637 3.637 3.637 3637 3.637 3.637 3.636 Year 27 3.636 3.636 3.636 3,636 3.636 3.636 3.637 Year 28 1.97 2.273 2.576 3.182 3485 3.636 Year 29 0.152 3.636 3.637 3.636 3.637 Month 10 Month 11 Month 12 0.758% 0.455% 0.152% 3.636 3.636 3.636 3.636 3.636 3.636 3,637 3.637 3.637 3.636 3.636 3.636 3.637 3.637 3.637 3.636 3.636 3.636 3.637 3.637 3.637 3.636 3.636 3.636 3.637 3.637 3,637 3.636 3.636 3.636 3.637 3.637 3.637 3.636 3.636 3.636 3.637 3.637 3.637 3.636 3.636 3.636 3.637 3.637 3.637 3.636 3.636 3.636 3637 3.637 3.637 3.636 3.636 3.636 3.637 3.637 3.637 3.636 3.636 3.636 1.061 1.364 1.667 3.636 3.637 3.636 3.637 3.636 3.637 3.636 3.637 3.636 3.637 3.636 3.637 3.636 3.637 3.636 0.455 3.636 3.637 3.636 3.637 3.636 3,637 3.636 3.637 2.879 0.758 Month 11 0.3975 3.175 3.175 3.174 Month 10 0.661 3,175 3.175 3.175 3.174 3.175 3.174 3.175 3.174 3.175 3.174 3.175 3.174 3.175 3.174 3.175 Month 12 0.132% 3,175 3.175 3.175 3.174 3.175 3.174 3.175 3.175 3.174 3.175 3.174 3.175 3.174 3.175 3.174 3.174 3.175 3.174 TABLE 4 Nonresidential Real Property Mid-Month Convention Straight Line-31.5 Years (for assets placed in service before May 13, 1993) Month Property Placed in Service Month 1 Month 2 Month 3 Month 4 Months Month 6 Month 7 Month 8 Month 9 Year 1 3D42% 2.778% 2.5135 1.9845 1.720% 14556 1.190% 09265 Year 2-7 3.175 3.175 3.175 3.175 3.175 3.175 3.175 3.175 3.175 Year 8 3.175 3.174 3.175 3.174 3.175 3.174 3.175 3.175 3.175 Year 9 3.174 3.175 3.174 3.175 3.174 3.175 3.174 3.175 3.174 Year 10 3.175 3.174 3.175 3.174 3.175 3.174 3.175 3.174 3.175 Year 11 3.174 3.175 3.174 3.175 3.174 3.175 3.174 3.175 3.174 Year 12 3.175 3.174 3.175 3.174 3.175 3.174 3.175 3.174 3.175 Year 13 3.174 3.175 3.174 3.175 3.174 3.175 3.174 3.175 3.174 Year 14 3.175 3.174 3.175 3.174 3.175 3.174 3.175 3.174 3.175 Year 15 3.174 3.175 3.174 3.175 3.174 3.175 3.174 3.175 3.174 Year 16 3.175 3.174 3.175 3.174 3.175 3.174 3.175 3.174 3.175 Year 17 3.174 3.175 3.174 3.175 3.174 3.175 3.174 3.175 3.174 Year 18 3.175 3.174 3.175 3.174 3.175 3.174 3.175 3.174 3.175 Year 19 3.174 3.175 3.174 3.175 3.174 3.175 3.174 3.175 3.174 Year 20 3.175 3.174 3.175 3.174 3.175 3.174 3.175 3.174 3.175 Year 21 3.174 3.175 3.174 3.175 3.174 3.175 3.174 3.175 3.174 Year 22 3.175 3.174 3.175 3.174 3.175 3.174 3.175 3.174 3.175 Year 2.3 3.174 3.175 3.174 3.175 3.174 3.175 3.174 3.115 3.174 Year 24 3.175 3.174 3.175 3.174 3.175 3.174 3.175 3.174 3.175 Year 25 3.174 3.175 3.174 3.175 3.174 3.175 3.174 3.175 3.174 Year 26 3.175 3.174 3.175 3.174 3.175 3.174 3.175 3.174 3.175 Year 27 3.174 3.175 3.174 3.175 3.174 3.175 3.174 3.175 3.174 Year 28 3.175 1.174 3.175 3.174 3.175 3.174 3.175 3.174 3.175 Year 29 3.174 3.175 3.174 3.175 3.174 3.175 3.174 3.175 3.174 Year 20 3.175 3.174 3.175 3.174 3.175 3.174 3.175 3.174 3.175 Year 31 3.174 3.175 3.174 3.175 3.174 3.175 3.174 3.175 3.174 Year 32 1.720 1.984 2.249 2.513 2.778 3.042 3.175 3.174 3.175 Year 33 0.132 0.397 0.661 3.125 3.175 3.174 3.174 3.175 3.175 3.174 3.175 3.174 3.174 3.175 3.174 3.174 3.175 3.174 3.175 3.175 3.174 3.174 3.175 3.175 3.174 3.174 3.175 3.175 3.174 3.175 3.174 3.175 3.174 3.175 3.174 3.175 3.174 3.174 3.175 3.174 3.175 1.19 3.175 3.174 3.175 3.174 1455 0.926 Month 10 Month 11 TABLE 5 Nonresidential Real Property Mid-Month Convention Straight Line-39 Years (for assets placed in service on or after May 13, 1993) Month Property Maced in Service Month 1 Month 2 Month 3 Month 4 Month 5 Month Month 7 Months Month 9 Year 1 2.4619 2.2475 2.0339 18195 1.6055 1.3915 1.1775 0.7498 Year 2-39 2.564 2.564 2.564 2564 2564 2.564 2564 2.564 Year 40 0.107 0.121 0.535 0.749 0.963 1.177 1.391 1.105 1.819 05355 2.564 2.033 0.3213 2.564 2.247 Month 12 0.1079 2.564 2.461
Step by Step Solution
There are 3 Steps involved in it

Get step-by-step solutions from verified subject matter experts