

Question: Tables Formula Sheet The table below represents a study that involved the measurement of body weight (X) and daily calorie consumption (Y) in three individuals.
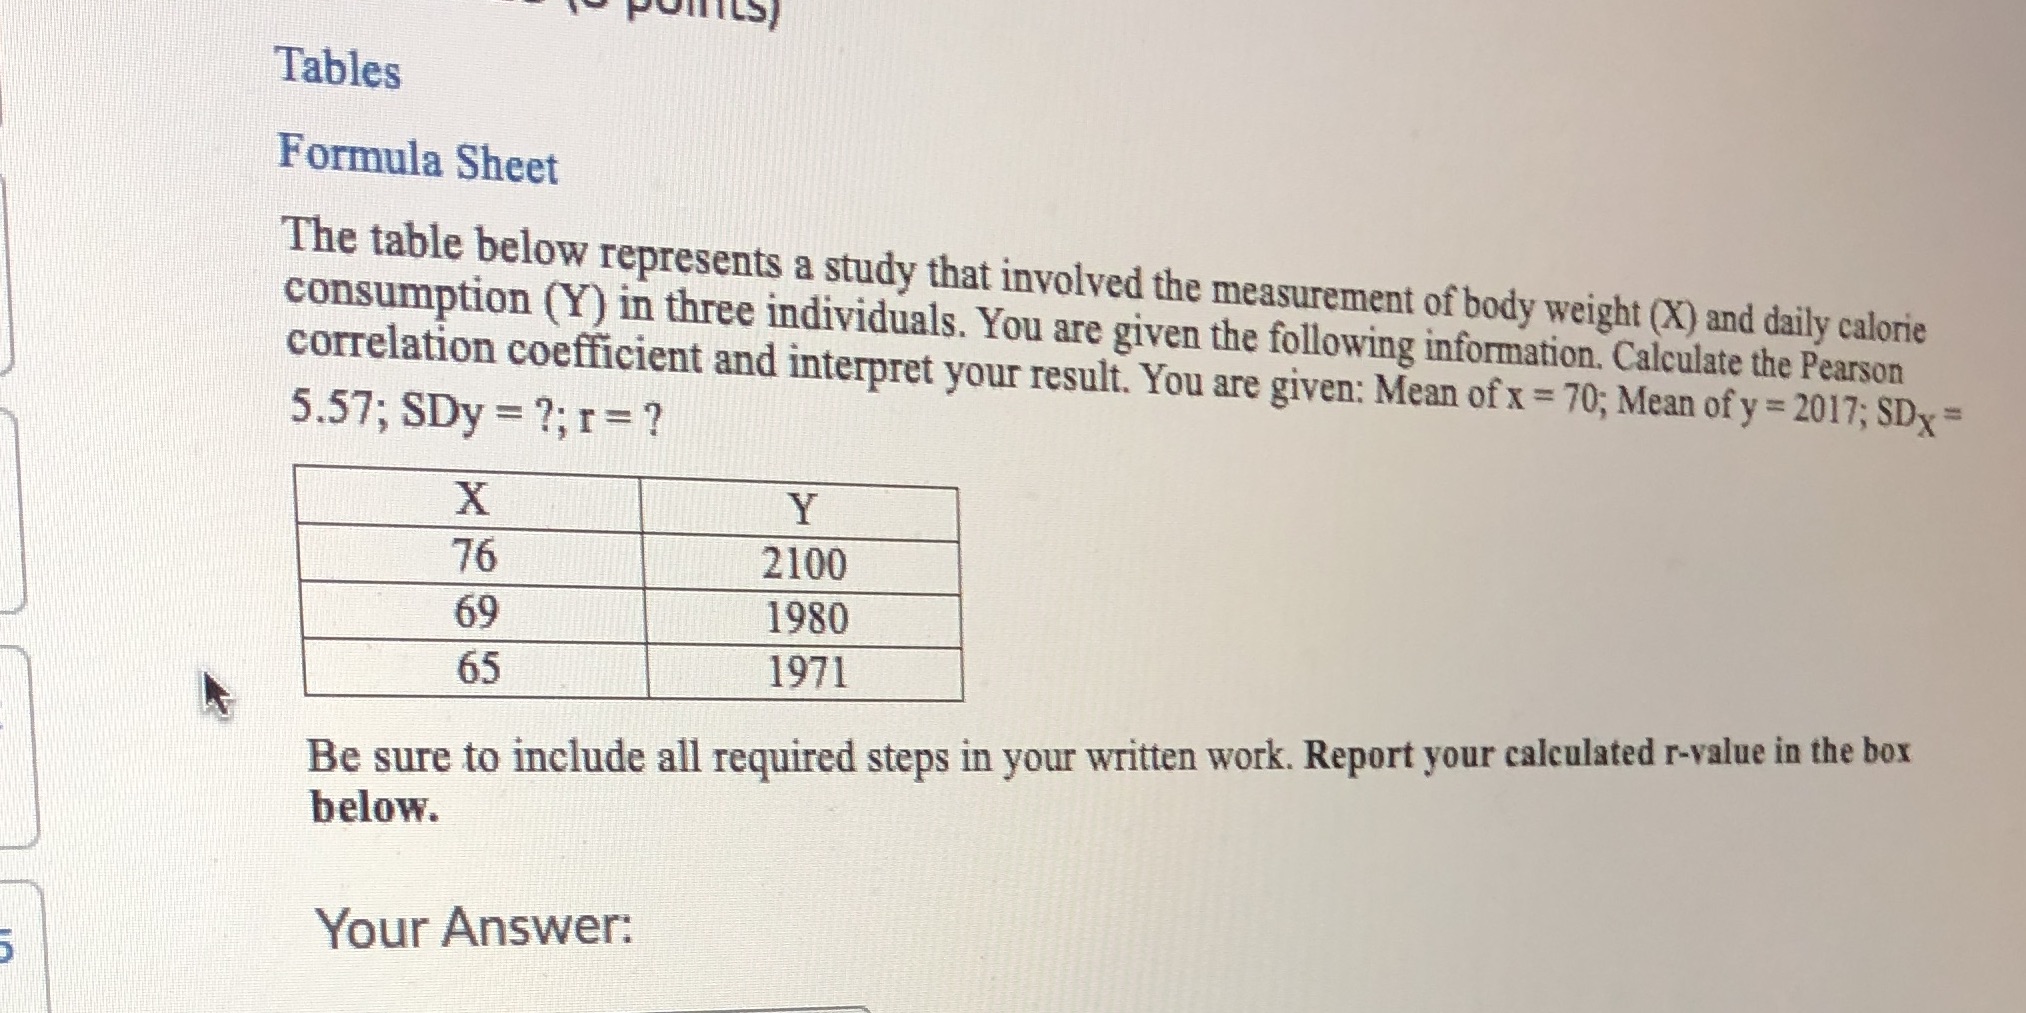
Tables Formula Sheet The table below represents a study that involved the measurement of body weight (X) and daily calorie consumption (Y) in three individuals. You are given the following information. Calculate the Pearson correlation coefficient and interpret your result. You are given: Mean of x = 70; Mean of y = 2017; SDy = 5.57; SDy = ?; 1 =? X Y 76 2100 69 1980 65 1971 Be sure to include all required steps in your written work. Report your calculated r-value in the box below. Your
Step by Step Solution
There are 3 Steps involved in it
1 Expert Approved Answer
Step: 1 Unlock

Question Has Been Solved by an Expert!
Get step-by-step solutions from verified subject matter experts
Step: 2 Unlock
Step: 3 Unlock