

Question: Tables: Table 1: Table 2: Table 3: Table 4: Table 5: Required information [The following Information applies to the questions displayed below.] DLW Corporation acquired
![Required information [The following Information applies to the questions displayed below.] DLW](https://dsd5zvtm8ll6.cloudfront.net/si.experts.images/questions/2024/10/66fbac870f4f0_73466fbac86b2b4e.jpg)
Tables:
Table 1:
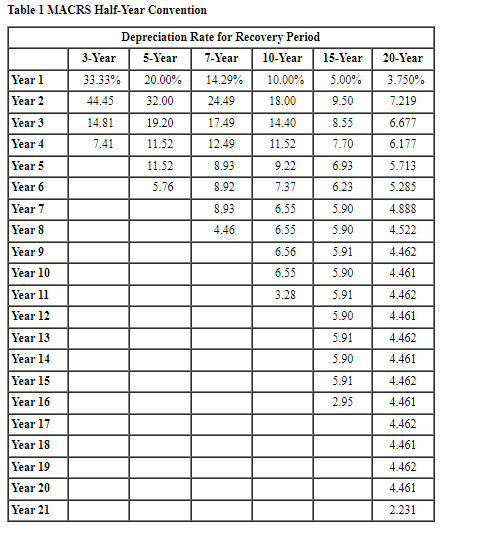
Table 2:
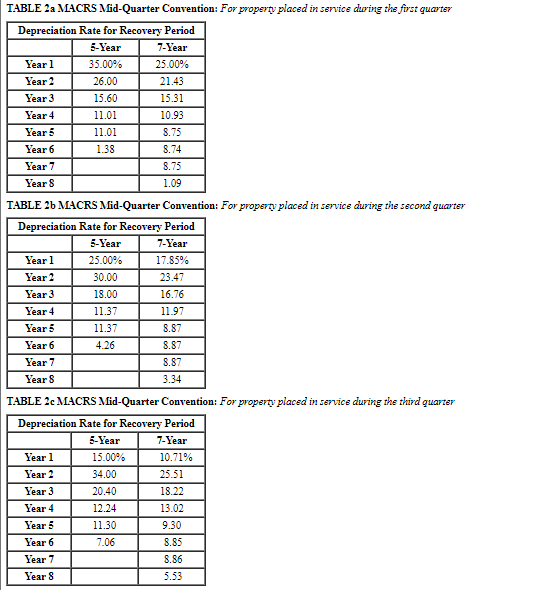
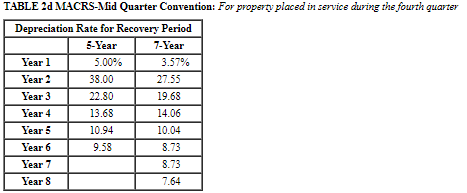
Table 3:
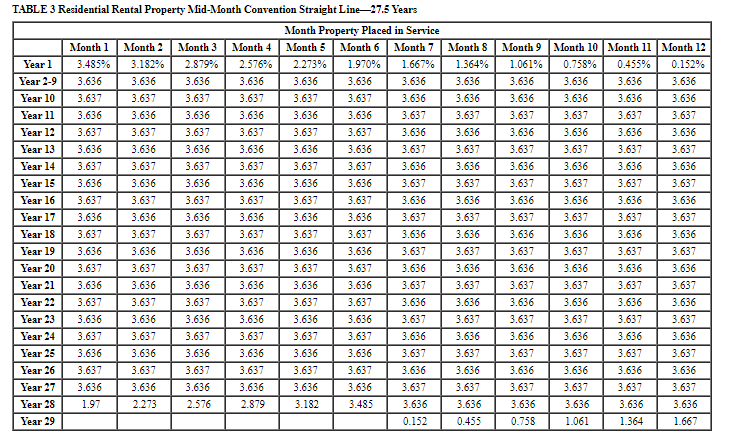 Table 4:
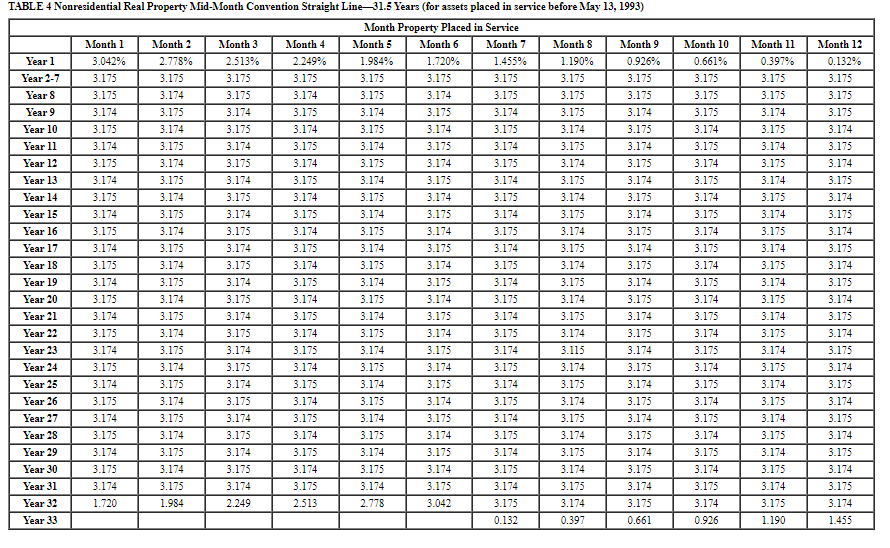 Table 5:
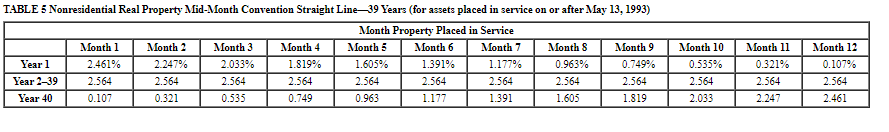
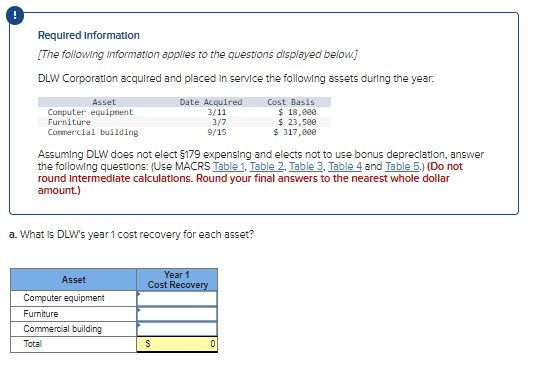
Required information [The following Information applies to the questions displayed below.] DLW Corporation acquired and placed in service the following assets during the year. Asset Date Acquired 3/11 Computer equipment Furniture Cost Basis $ 18,000 $ 23,500 $ 317,000 3/7 Commercial building 9/15 Assuming DLW does not elect $179 expensing and elects not to use bonus depreciation, answer the following questions: (Use MACRS Table 1, Table 2, Table 3, Table 4 and Table 5.) (Do not round Intermediate calculations. Round your final answers to the nearest whole dollar amount.) a. What is DLW's year 1 cost recovery for each asset? Year 1 Asset Cost Recovery Computer equipment Furniture Commercial building Total S 0 b. What is DLW's year 3 cost recovery for each asset If DLW sells these assets on 2/24 of year 3? Asset Year 3 Cost Recovery Computer equipment Furniture Commercial building Total Table 1 MACRS Half-Year Convention Year 1 Year 2 Year 3 Year 4 Year 5 Year 6 Year 7 Year 8 Year 9 Year 10 Year 11 Year 12 Year 13 Year 14 Year 15 Year 16 Year 17 Year 18 Year 19 Year 20 Year 21 Depreciation Rate for Recovery Period 3-Year 5-Year 7-Year 10-Year 15-Year 33.33% 20.00% 14.29% 10.00% 5.00% 44.45 32.00 24.49 18.00 9.50 14.81 19.20 17.49 14.40 8.55 7.41 11.52 12.49 11.52 7.70 11.52 8.93 9.22 6.93 5.76 8.92 7.37 6.23 8.93 6.55 5.90 4.46 6.55 5.90 6.56 5.91 6.55 5.90 3.28 5.91 5.90 5.91 5.90 5.91 2.95 20-Year 3.750% 7.219 6.677 6.177 5.713 5.285 4.888 4.522 4.462 4.461 4.462 4.461 4.462 4.461 4.462 4.461 4.462 4.461 4.462 4.461 2.231 TABLE 2a MACRS Mid-Quarter Convention: For property placed in service during the first quarter Depreciation Rate for Recovery Period 5-Year 7-Year Year 1 35.00% 25.00% Year 2 26.00 21.43 Year 3 15.60 15.31 Year 4 11.01 10.93 Year 5 11.01 8.75 Year 6 1.38 8.74 Year 7 8.75 Year S 1.09 TABLE 26 MACRS Mid-Quarter Convention: For property placed in service during the second quarter Depreciation Rate for Recovery Period 5-Year 7-Year Year 1 25.00% 17.85% Year 2 30.00 23.47 Year 3 18.00 16.76 Year 4 11.37 11.97 Year 5 11.37 8.87 Year 6 4.26 8.87 Year 7 8.87 Year 8 3.34 TABLE 2c MACRS Mid-Quarter Convention: For property placed in service during the third quarter Depreciation Rate for Recovery Period 5-Year 7-Year Year 1 15.00% 10.71% Year 2 34.00 25.51 Year 3 20.40 18.22 Year 4 12.24 13.02 Year 5 11.30 9.30 Year 6 7.06 8.85 Year 7 8.86 Year 8 5.53 TABLE 2d MACRS-Mid Quarter Convention: For property placed in service during the fourth quarter Depreciation Rate for Recovery Period 5-Year 7-Year Year 1 Year 2 Year 3 Year 4 Year 5 Year 6 Year 7 Year 8 5.00% 38.00 22.80 13.68 10.94 9.58 3.57% 27.55 19.68 14.06 10.04 8.73 8.73 7.64 TABLE 3 Residential Rental Property Mid-Month Convention Straight Line-27.5 Years Month Property Placed in Service Month 1 Month 2 Month 3 Month 4 Month 5 Month 6 Month 7 Month 8 Month 9 Month 10 Month 11 Month 12 Year 1 3.485% 3.182% 2.879% 2.576% 2.273% 1.970% 1.667% 1.364% 1.061% 0.758% 0.455% 0.152% Year 2-9 3.636 3.636 3.636 3.636 3.636 3.636 3.636 3.636 3.636 3.636 3.636 3.636 Year 10 3.637 3.637 3.637 3.637 3.637 3.637 3.636 3.636 3.636 3.636 3.636 3.636 Year 11 3.636 3.636 3.636 3.636 3.636 3.636 3.637 3.637 3.637 3.637 3.637 3.637 Year 12 3.637 3.637 3.637 3.637 3.637 3.637 3.636 3.636 3.636 3.636 3.636 3.636 Year 13 3.636 3.636 3.636 3.636 3.636 3.636 3.637 3.637 3.637 3.637 3.637 3.637 Year 14 3.637 3.637 3.637 3.637 3.637 3.637 3.636 3.636 3.636 3.636 3.636 3.636 Year 15 3.636 3.636 3.636 3.636 3.636 3.636 3.637 3.637 3.637 3.637 3.637 3.637 Year 16 3.637 3.637 3.637 3.637 3.637 3.637 3.636 3.636 3.636 3.636 3.636 3.636 Year 17 3.636 3.636 3.636 3.636 3.636 3.636 3.637 3.637 3.637 3.637 3.637 3.637 Year 18 3.637 3.637 3.637 3.637 3.637 3.637 3.636 3.636 3.636 3.636 3.636 3.636 Year 19 3.636 3.636 3.636 3.636 3.636 3.636 3.637 3.637 3.637 3.637 3.637 3.637 Year 20 3.637 3.637 3.637 3.637 3.637 3.637 3.636 3.636 3.636 3.636 3.636 3.636 Year 21 3.636 3.636 3.636 3.636 3.636 3.636 3.637 3.637 3.637 3.637 3.637 3.637 Year 22 3.637 3.637 3.637 3.637 3.637 3.637 3.636 3.636 3.636 3.636 3.636 3.636 Year 23 3.636 3.636 3.636 3.636 3.636 3.636 3.637 3.637 3.637 3.637 3.637 3.637 Year 24 3.637 3.637 3.637 3.637 3.637 3.637 3.636 3.636 3.636 3.636 3.636 3.636 Year 25 3.636 3.636 3.636 3.636 3.636 3.636 3.637 3.637 3.637 3.637 3.637 3.637 Year 26 3.637 3.637 3.637 3.637 3.637 3.637 3.636 3.636 3.636 3.636 3.636 3.636 Year 27 3.636 3.636 3.636 3.636 3.636 3.636 3.637 3.637 3.637 3.637 3.637 3.637 Year 28 1.97 2.273 2.576 2.879 3.182 3.485 3.636 3.636 3.636 3.636 3.636 3.636 Year 29 0.152 0.455 0.758 1.061 1.364 1.667 TABLE 4 Nonresidential Real Property Mid-Month Convention Straight Line-31.5 Years (for assets placed in service before May 13, 1993) Month Property Placed in Service Month 5 Month 6 Month 7 Month 8 Month 1 3.042% Month 2 2.778% Month 3 2.513% Month 4 2.249% Month 9 0.926% Year 1 1.984% 1.720% 1.455% 1.190% Year 2-7 3.175 3.175 3.175 3.175 3.175 3.175 3.175 3.175 3.175 Year 8 3.175 3.174 3.175 3.174 3.175 3.174 3.175 3.175 3.175 Year 9 3.174 3.175 3.174 3.175 3.174 3.175 3.174 3.175 3.174 Year 10 3.175 3.174 3.175 3.174 3.175 3.174 3.175 3.174 3.175 Year 11 3.174 3.175 3.174 3.175 3.174 3.175 3.174 3.175 3.174 Year 12 3.175 3.174 3.175 3.174 3.175 3.174 3.175 3.174 3.175 Year 13 3.174 3.175 3.174 3.175 3.174 3.175 3.174 3.175 3.174 Year 14 3.175 3.174 3.175 3.174 3.175 3.174 3.175 3.174 3.175 Year 15 3.174 3.175 3.174 3.175 3.174 3.175 3.174 3.175 3.174 Year 16 3.175 3.174 3.175 3.174 3.175 3.174 3.175 3.174 3.175 Year 17 3.174 3.175 3.174 3.175 3.174 3.175 3.174 3.175 3.174 Year 18 3.175 3.174 3.175 3.174 3.175 3.174 3.175 3.174 3.175 Year 19 3.174 3.175 3.174 3.175 3.174 3.175 3.174 3.175 3.174 Year 20 3.175 3.174 3.175 3.174 3.175 3.174 3.175 3.174 3.175 Year 21 3.174 3.175 3.174 3.175 3.174 3.175 3.174 3.175 3.174 Year 22 3.175 3.174 3.175 3.174 3.175 3.174 3.175 3.174 3.175 Year 23 3.174 3.175 3.174 3.175 3.174 3.175 3.174 3.115 3.174 Year 24 3.175 3.174 3.175 3.174 3.175 3.174 3.175 3.174 3.175 Year 25 3.174 3.175 3.174 3.175 3.174 3.175 3.174 3.175 3.174 Year 26 3.175 3.174 3.175 3.174 3.175 3.174 3.175 3.174 3.175 Year 27 3.174 3.175 3.174 3.175 3.174 3.175 3.174 3.175 3.174 Year 28 3.175 3.174 3.175 3.174 3.175 3.174 3.175 3.174 3.175 Year 29 3.174 3.175 3.174 3.175 3.174 3.175 3.174 3.175 3.174 Year 30 3.175 3.174 3.175 3.174 3.175 3.174 3.175 3.174 3.175 Year 31 3.174 3.175 3.174 3.175 3.174 3.175 3.174 3.175 3.174 Year 32 1.720 1.984 2.249 2.513 2.778 3.042 3.175 3.174 3.175 Year 33 0.132 0.397 0.661 Month 10 0.661% 3.175 3.175 3.175 3.174 3.175 3.174 3.175 3.174 3.175 3.174 3.175 3.174 3.175 3.174 3.175 3.174 3.175 3.174 3.175 3.174 3.175 3.174 3.175 3.174 3.175 3.174 0.926 Month 11 0.397% 3.175 3.175 3.174 3.175 3.174 3.175 3.174 3.175 3.174 3.175 3.174 3.175 3.174 3.175 3.174 3.175 3.174 3.175 3.174 3.175 3.174 3.175 3.174 3.175 3.174 3.175 1.190 Month 12 0.132% 3.175 3.175 3.175 3.174 3.175 3.174 3.175 3.174 3.175 3.174 3.175 3.174 3.175 3.174 3.175 3.174 3.175 3.174 3.175 3.174 3.175 3.174 3.175 3.174 3.175 3.174 1.455 TABLE 5 Nonresidential Real Property Mid-Month Convention Straight Line-39 Years (for assets placed in service on or after May 13, 1993) Month Property Placed in Service Month 5 Month 6 Month 7 Month 8 Month 9 Month 1 2.461% 2.564 Month 2 2.247% 2.564 Month 3 2.033% 2.564 Month 4 1.819% 1.605% 1.391% Year 1 Year 2-39 1.177% 0.963% 0.749% 2.564 2.564 2.564 2.564 2.564 2.564 Year 40 0.107 0.321 0.535 0.749 0.963 1.177 1.391 1.605 1.819 Month 10 0.535% 2.564 2.033 Month 11 0.321% 2.564 2.247 Month 12 0.107% 2.564 2.461
Step by Step Solution
There are 3 Steps involved in it

Get step-by-step solutions from verified subject matter experts