

Question: tabulate excel spreadsheet for the missing numbers. Show the equations utilized (=price and =yield equations in excel). please show before and after with excel. This
tabulate excel spreadsheet for the missing numbers. Show the equations utilized (=price and =yield equations in excel). please show before and after with excel. This is my 7th time posting it and nobody can give me a correct answer. I will make sure to thumbs up answer if it is correct! thank you
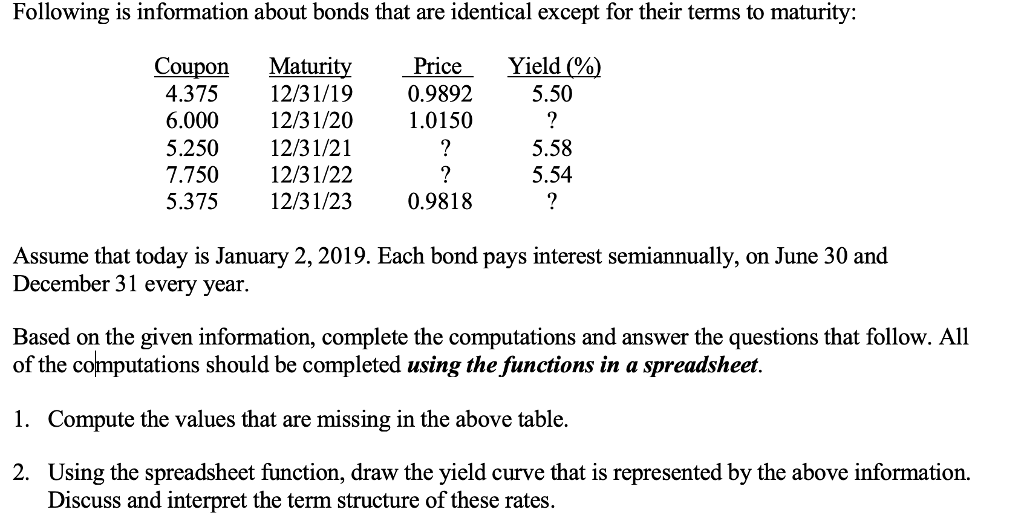
Following is information about bonds that are identical except for their terms to maturity: Coupon Maturity Price Yield (%) 0.9892 1.0150 4.37512/31/19 6.00012/31/20 5.250 12/31/21 7.75012/31/22 5.375 12/31/23 5.50 5.58 5.54 0.9818 Assume that today is January 2,2019. Each bond pays interest semiannually, on June 30 and December 31 every year Based on the given information, complete the computations and answer the questions that follow. All of the computations should be completed using the functions in a spreadsheet 1. Compute the values that are missing in the above table. 2. Using the spreadsheet function, draw the yield curve that is represented by the above information. Discuss and interpret the term structure of these rates
Step by Step Solution
There are 3 Steps involved in it

Get step-by-step solutions from verified subject matter experts