

Question: Tafel plot ( 2 0 p t The following data were obtained for the reduction of species R - to R - in a stirred
Tafel plot
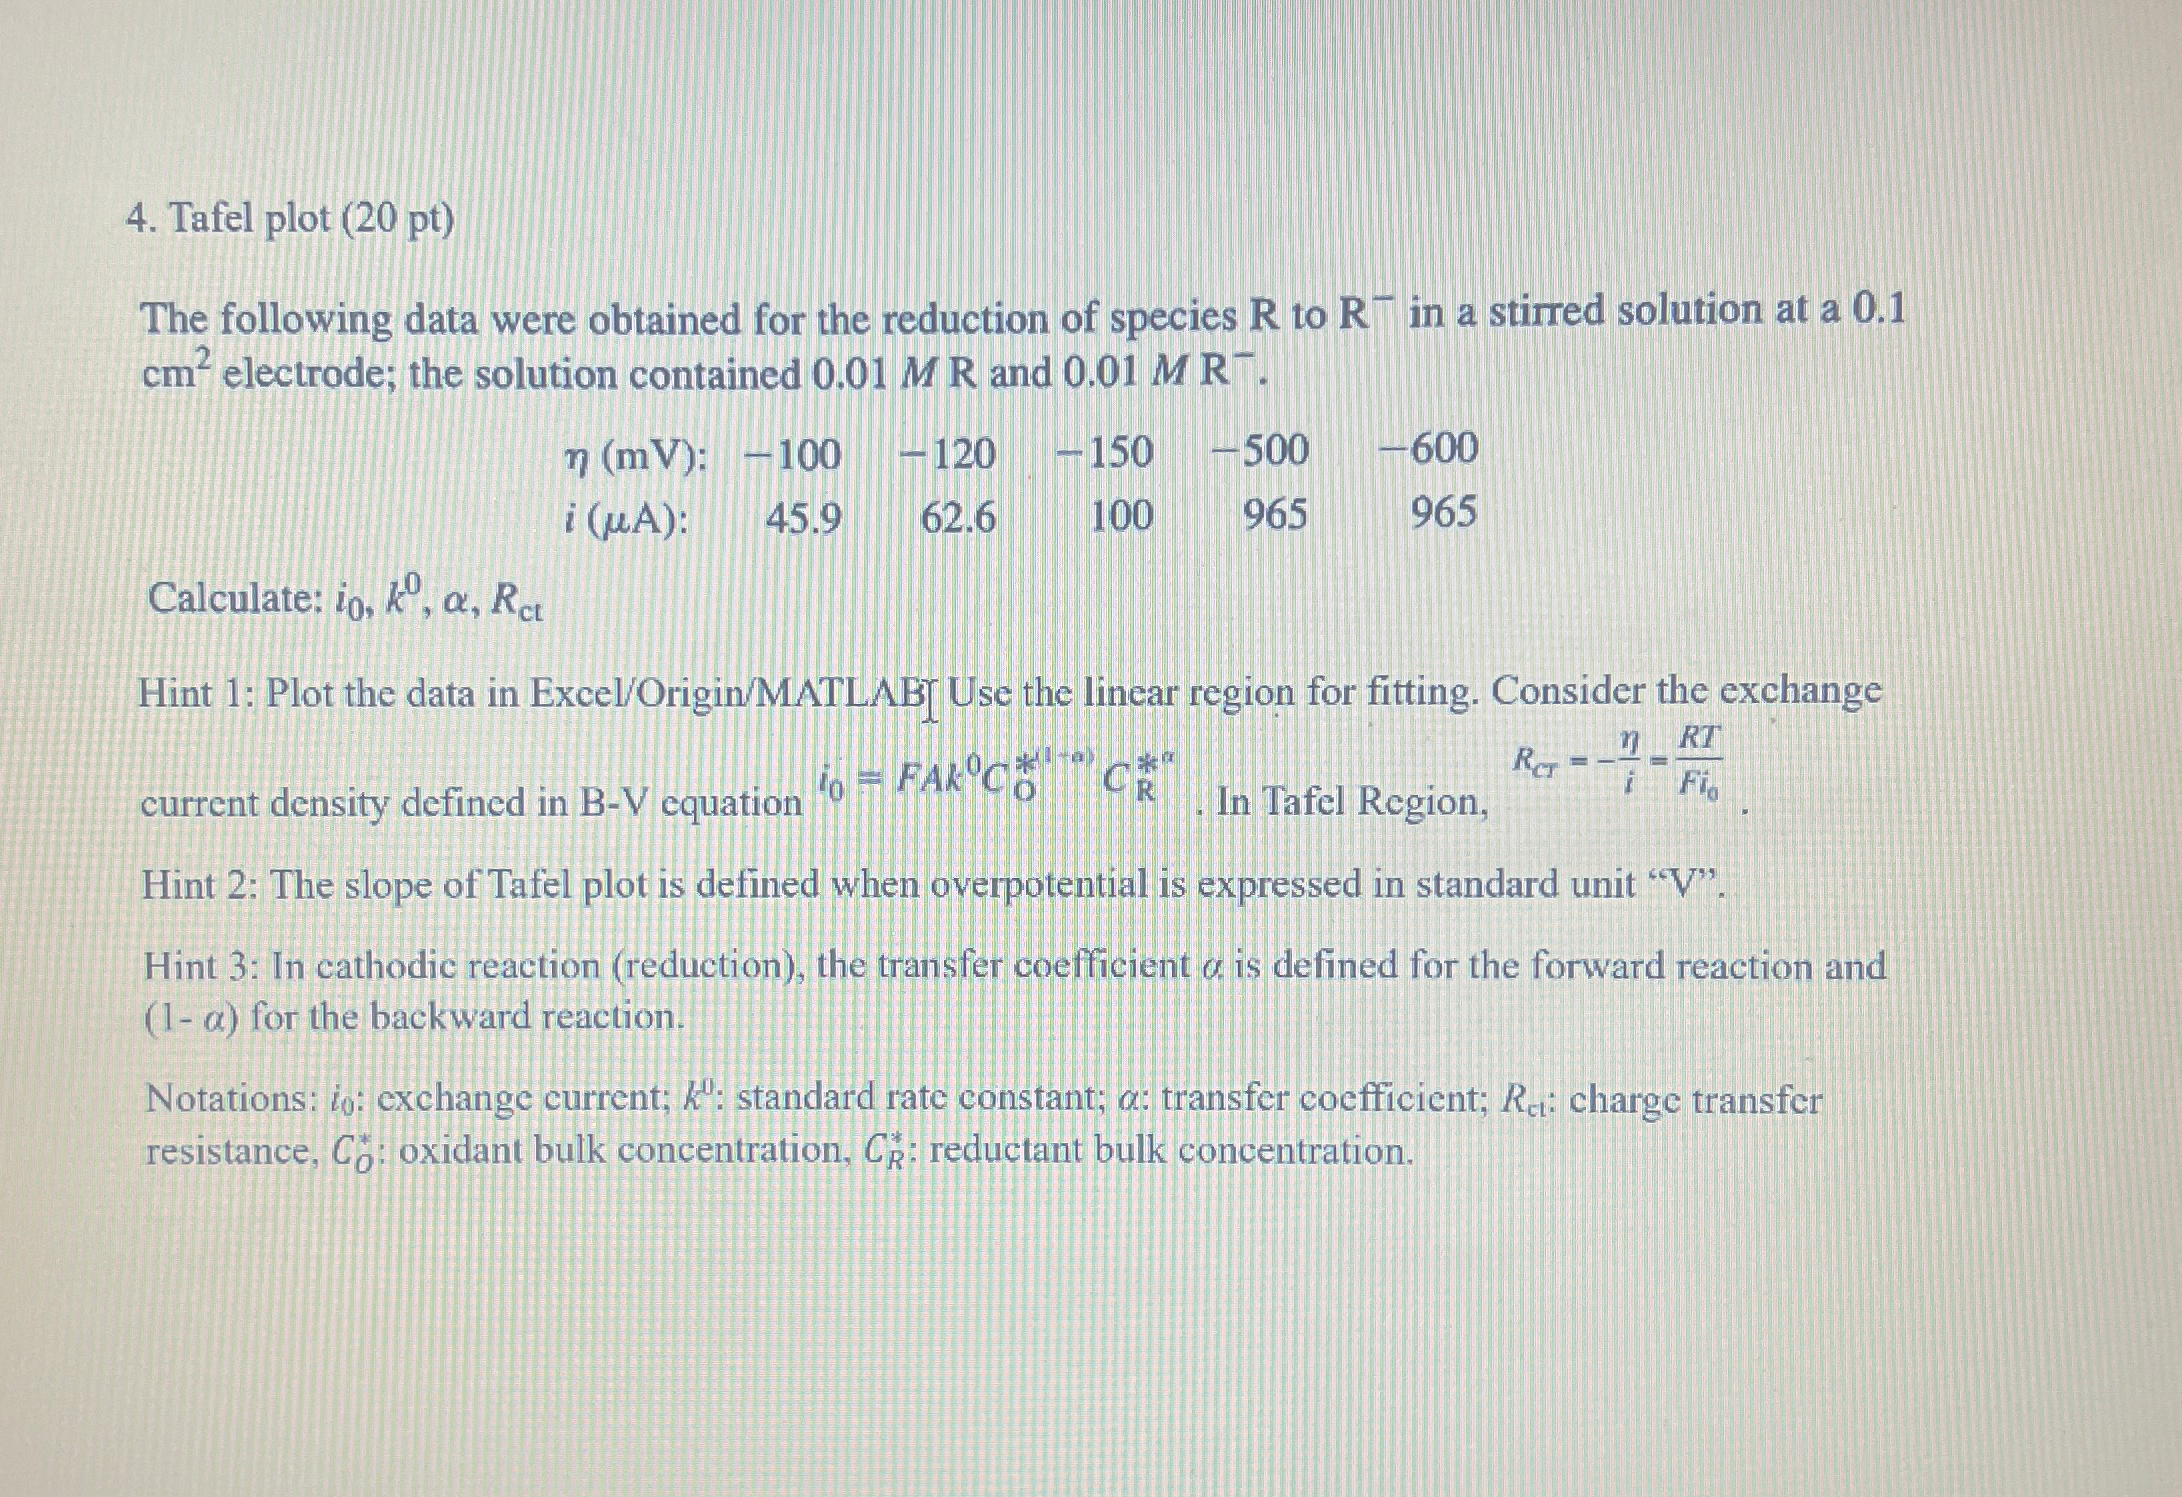
The following data were obtained for the reduction of species to in a stirred solution at a electrode; the solution contained and
table::
Calculate:
Hint : Plot the data in ExcelOriginMATLAB Use the linear region for fitting. Consider the exchange current density defined in equation In Tafel Region,
Hint : The slope of Tafel plot is defined when overpotential is expressed in standard unit V
Hint : In cathodic reaction reduction the transfer coefficient is defined for the forward reaction and for the backward reaction.
Notations: : exchange current; : standard rate constant; : transfer coefficient; : charge transfer resistance, : oxidant bulk concentration, : reductant bulk concentration.
Step by Step Solution
There are 3 Steps involved in it
1 Expert Approved Answer
Step: 1 Unlock

The task involves calculating several electrochemical parameters from the Tafel plot data including the exchange current i standard rate constant k ch... View full answer
Question Has Been Solved by an Expert!
Get step-by-step solutions from verified subject matter experts
Step: 2 Unlock
Step: 3 Unlock