

Question: Take a look at this graph which is showing total amount of gas (A) in the tank of car after driving for t days.
Take a look at this graph which is showing total amount of gas (A) in the tank of car after driving for t days. 1) Estimate instantaneous consumption rate @ t=4 2) What day was the rate of consumption the largest?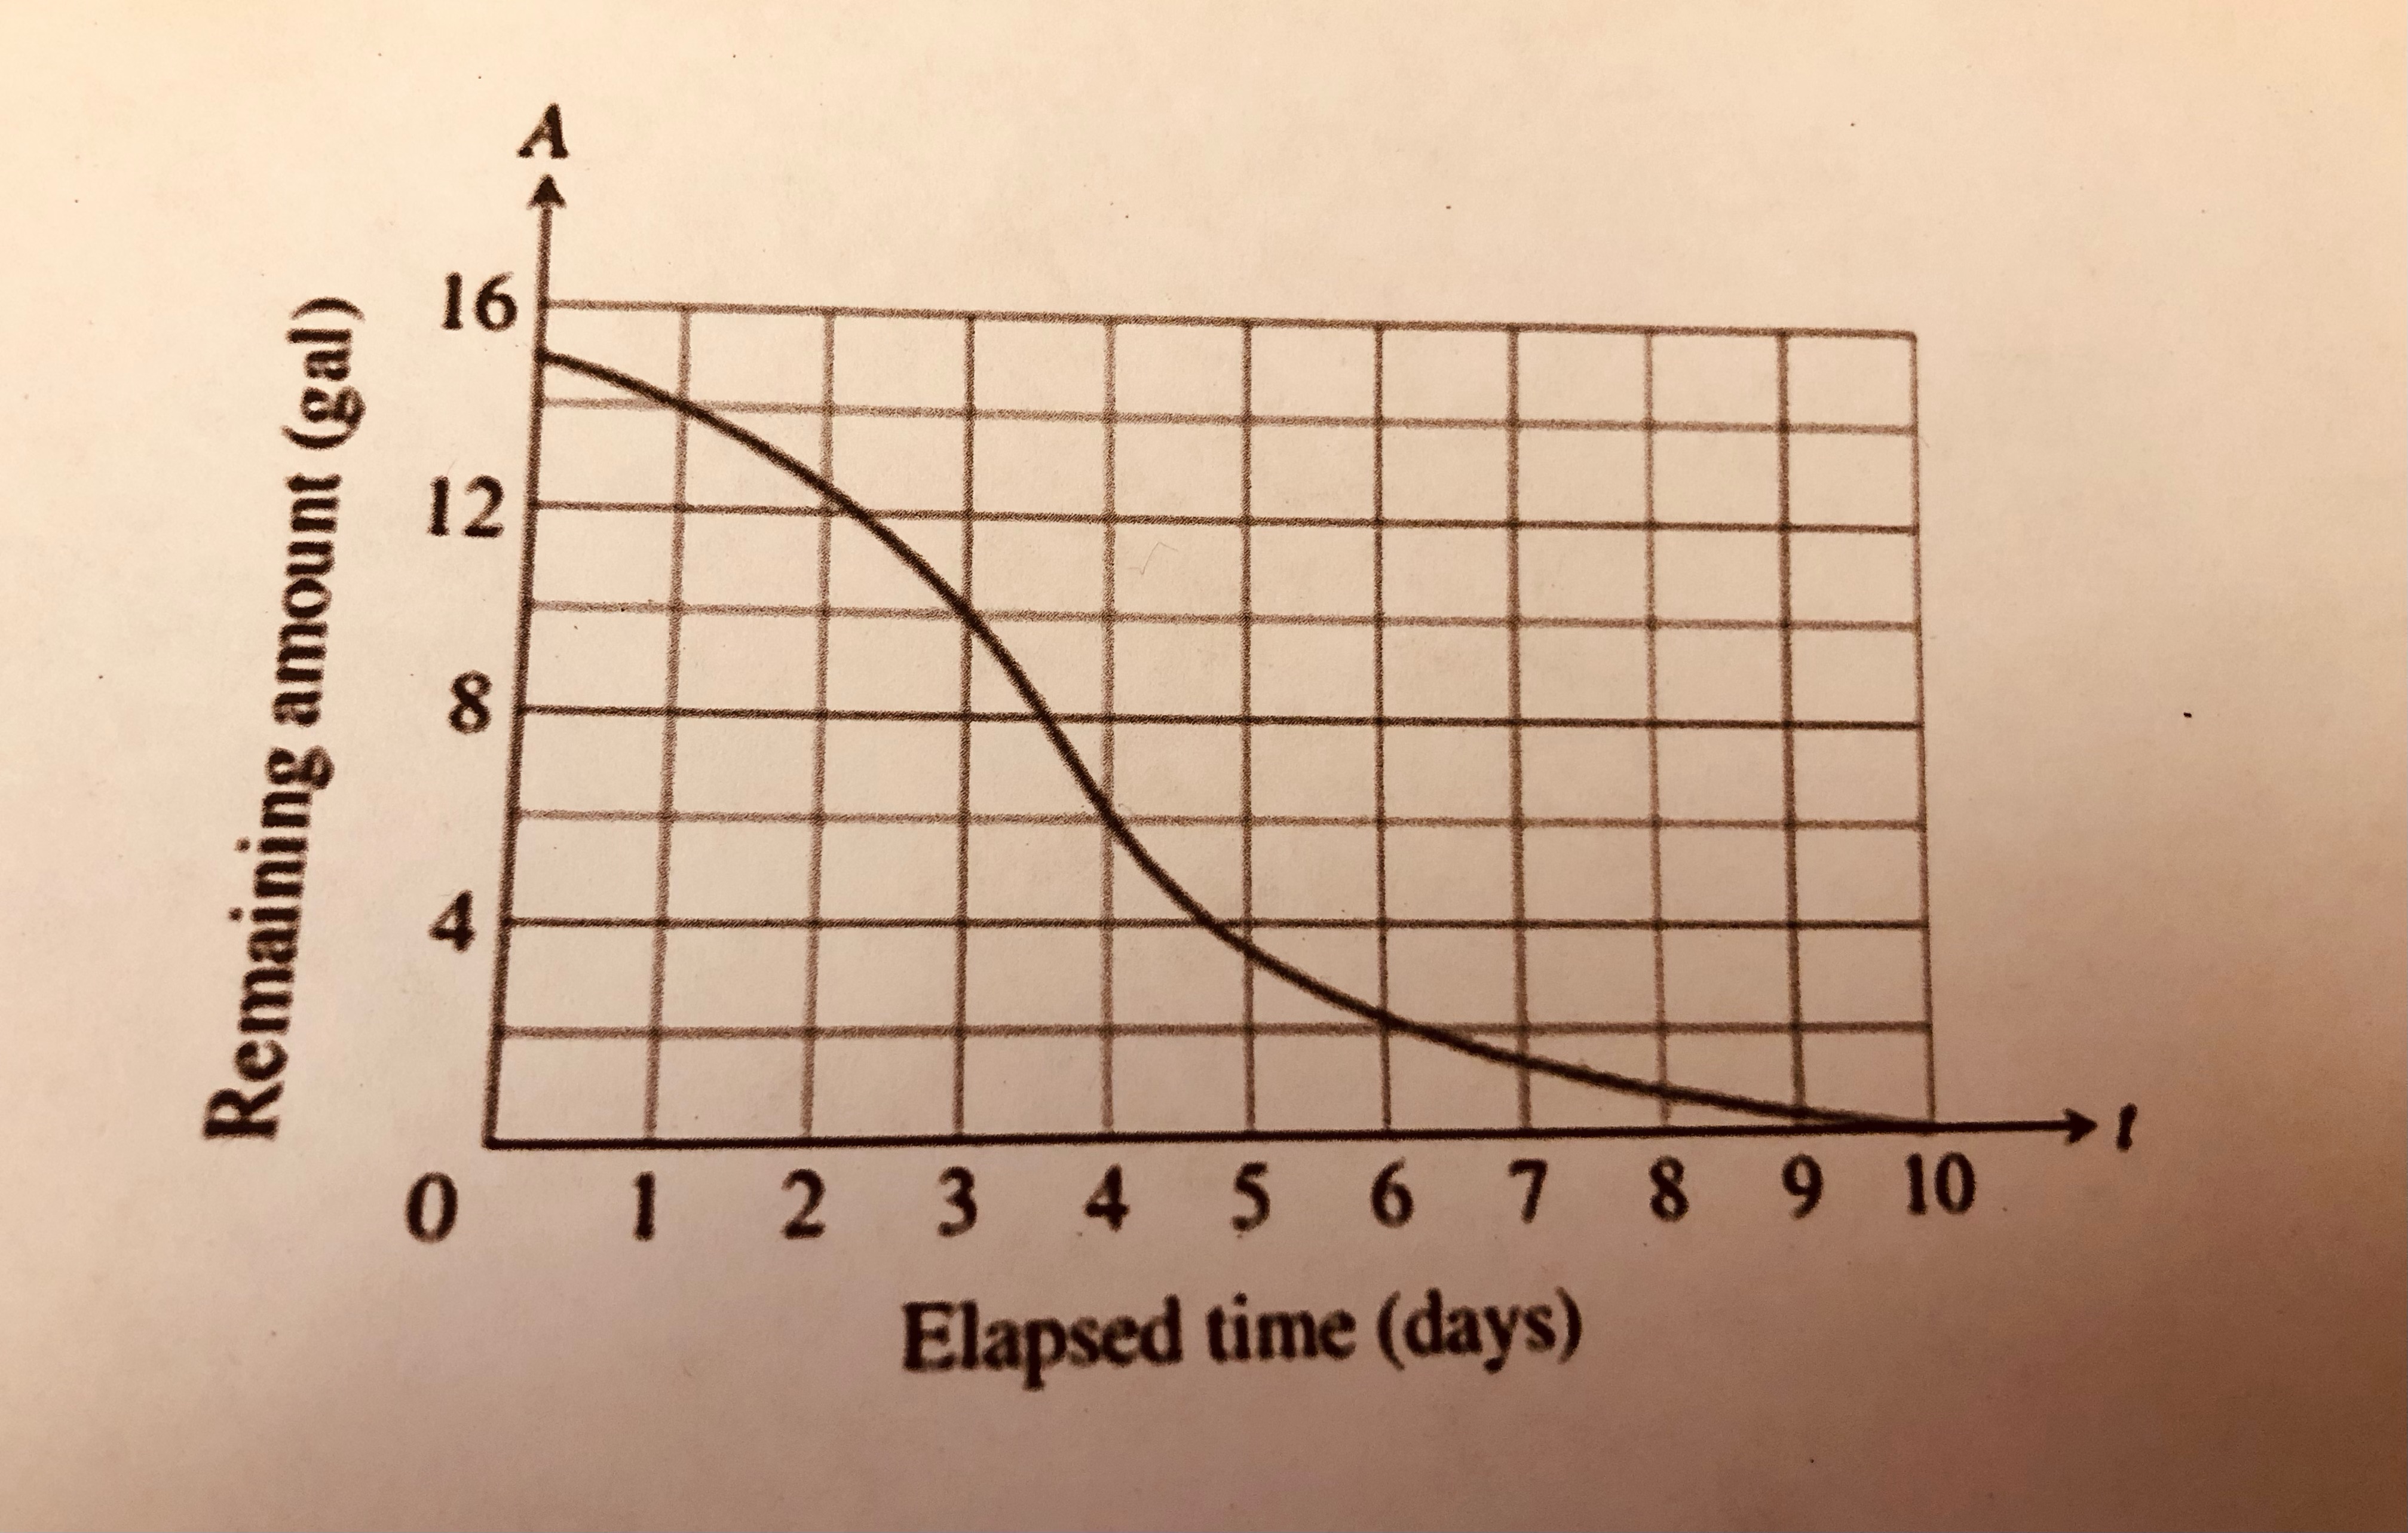
Remaining amount (gal) 16 12 A 8 0 1 2 3 4 5 6 7 8 9 10 Elapsed time (days)
Step by Step Solution
★★★★★
3.43 Rating (175 Votes )
There are 3 Steps involved in it
1 Expert Approved Answer
Step: 1 Unlock

To estimate the instantaneous consumption rate at t 4 we can calculate the slope of the tangent line ... View full answer
Question Has Been Solved by an Expert!
Get step-by-step solutions from verified subject matter experts
Step: 2 Unlock
Step: 3 Unlock