

Question: Take a Test - Daunyelle Robinson - Google Chrome - X mathxl.com/Student/PlayerTest.aspx?testld=233512582¢erwin=yes Lo 2021 Fall Session A Math 201-10 Daunyelle Robinson | 09/19/21 8:31 PM
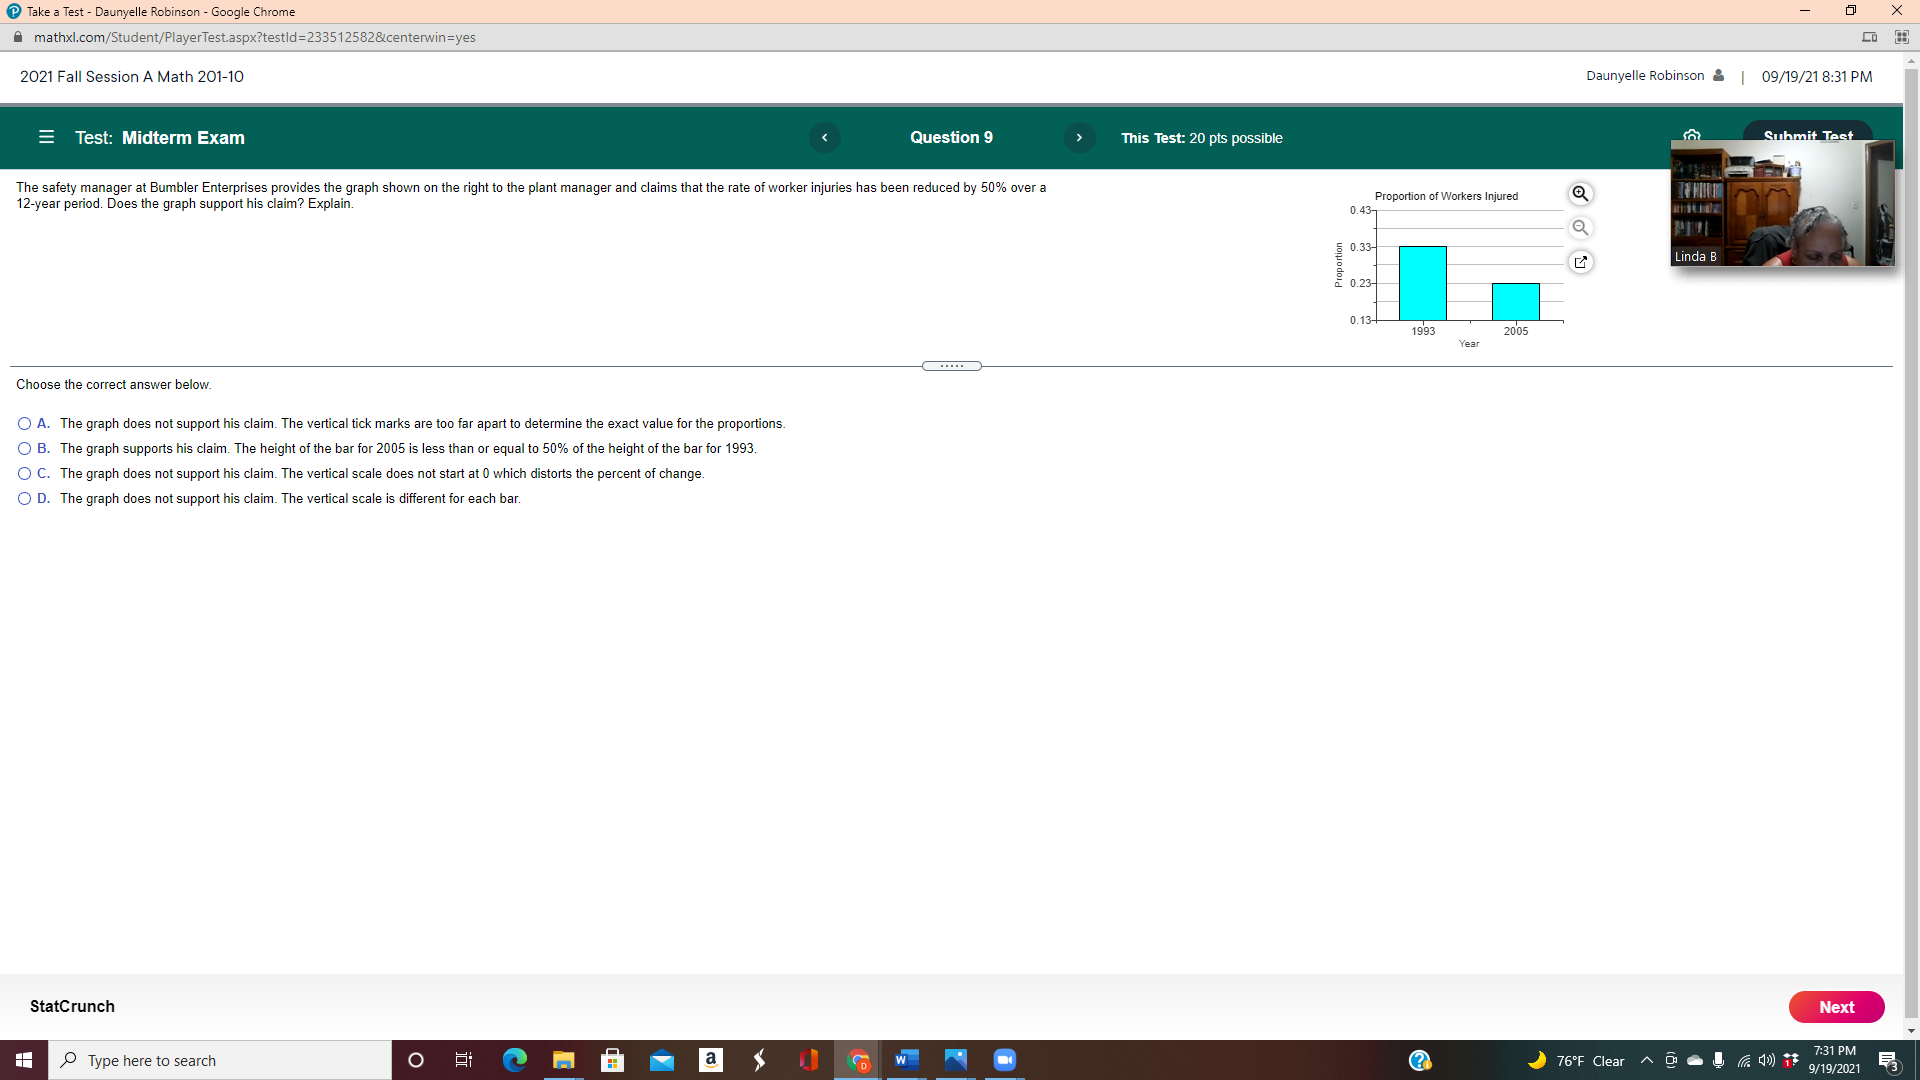
Take a Test - Daunyelle Robinson - Google Chrome - X mathxl.com/Student/PlayerTest.aspx?testld=233512582¢erwin=yes Lo 2021 Fall Session A Math 201-10 Daunyelle Robinson | 09/19/21 8:31 PM = Test: Midterm Exam Question 9 This Test: 20 pts possible Submit Test The safety manager at Bumbler Enterprises provides the graph shown on the right to the plant manager and claims that the rate of worker injuries has been reduced by 50% over a 12-year period. Does the graph support his claim? Explain. Proportion of Workers Injured 0.43- 0.33 Linda B 0.23 0.13- 1993 2005 Year Choose the correct answer below. O A. The graph does not support his claim. The vertical tick marks are too far apart to determine the exact value for the proportions. O B. The graph supports his claim. The height of the bar for 2005 is less than or equal to 50% of the height of the bar for 1993. O C. The graph does not support his claim. The vertical scale does not start at 0 which distorts the percent of change. O D. The graph does not support his claim. The vertical scale is different for each bar. StatCrunch Next Type here to search O 76F Clear ~g - 18 7:31 PM 9/19/2021
Step by Step Solution
There are 3 Steps involved in it

Get step-by-step solutions from verified subject matter experts