

Question: Take a Test - Daunyelle Robinson - Google Chrome - X mathxl.com/Student/PlayerTest.aspx?testld=2335125828centerwin=yes Lo 2021 Fall Session A Math 201-10 Daunyelle Robinson & | 09/19/21 8:25
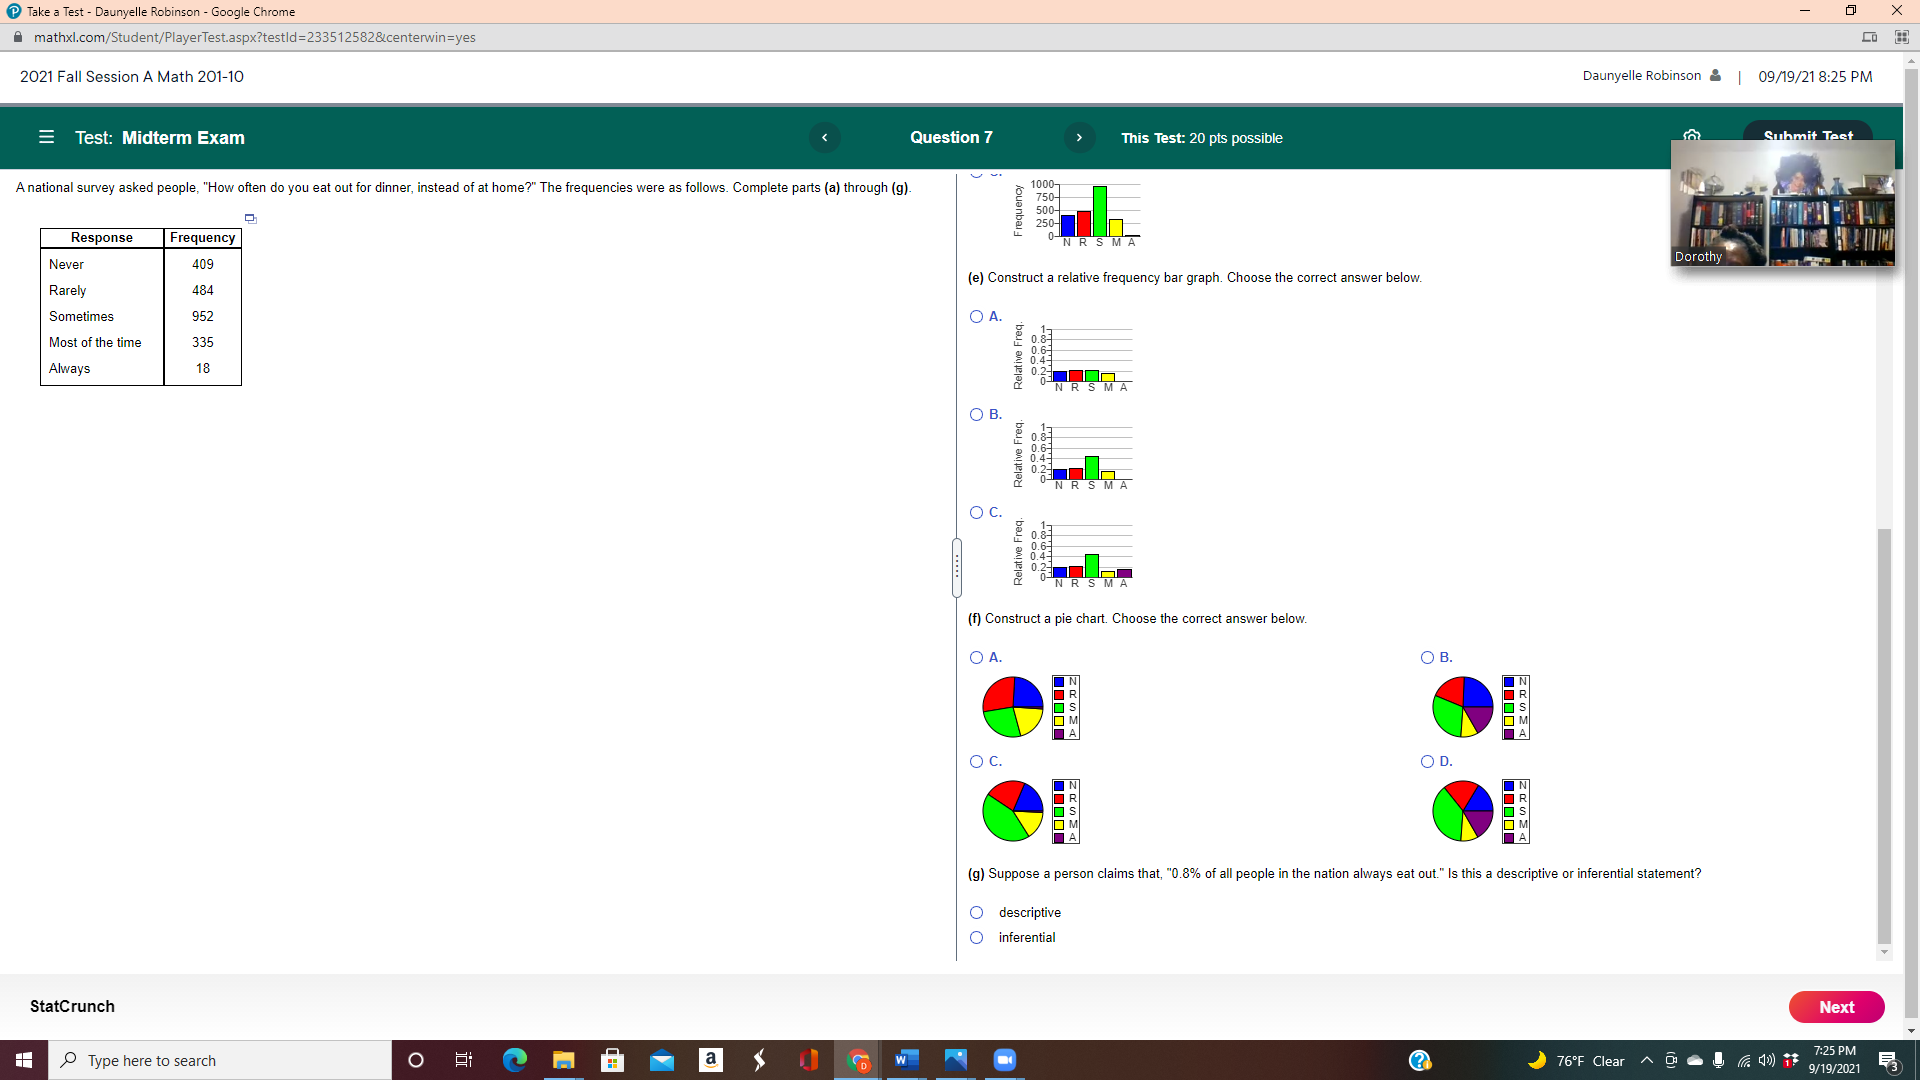
Take a Test - Daunyelle Robinson - Google Chrome - X mathxl.com/Student/PlayerTest.aspx?testld=2335125828centerwin=yes Lo 2021 Fall Session A Math 201-10 Daunyelle Robinson & | 09/19/21 8:25 PM Test: Midterm Exam Question 7 This Test: 20 pts possible Submit Test A national survey asked people, "How often do you eat out for dinner, instead of at home?" The frequencies were as follows. Complete parts (a) through (g)- 1000- 750- Frequency 500- 250- Response Frequency NRS Never Dorothy 409 (e) Construct a relative frequency bar graph. Choose the correct answer below. Rarely 484 Sometimes 952 O A. Most of the time 335 Relative Freq Always 18 NR MA OB Relative Freq NRSMA O C. Relative Freq. NRSMA (f) Construct a pie chart. Choose the correct answer below. OA O B. DZU DZ O C. OD. M A A (g) Suppose a person claims that, "0.8% of all people in the nation always eat out." Is this a descriptive or inferential statement? descriptive inferential StatCrunch Next Type here to search O W 76OF Clear ~ g ! # q 7:25 PM 9/19/2021
Step by Step Solution
There are 3 Steps involved in it

Get step-by-step solutions from verified subject matter experts