

Question: Take a Test - Desislava Dureva - Google Chrome - X mathxl.com/Student/PlayerTest.aspx?testld=211524841¢erwin=yes ECO 4223 Money and Banking Spring 2020 (Professor Eric Levy) Desislava Dureva &
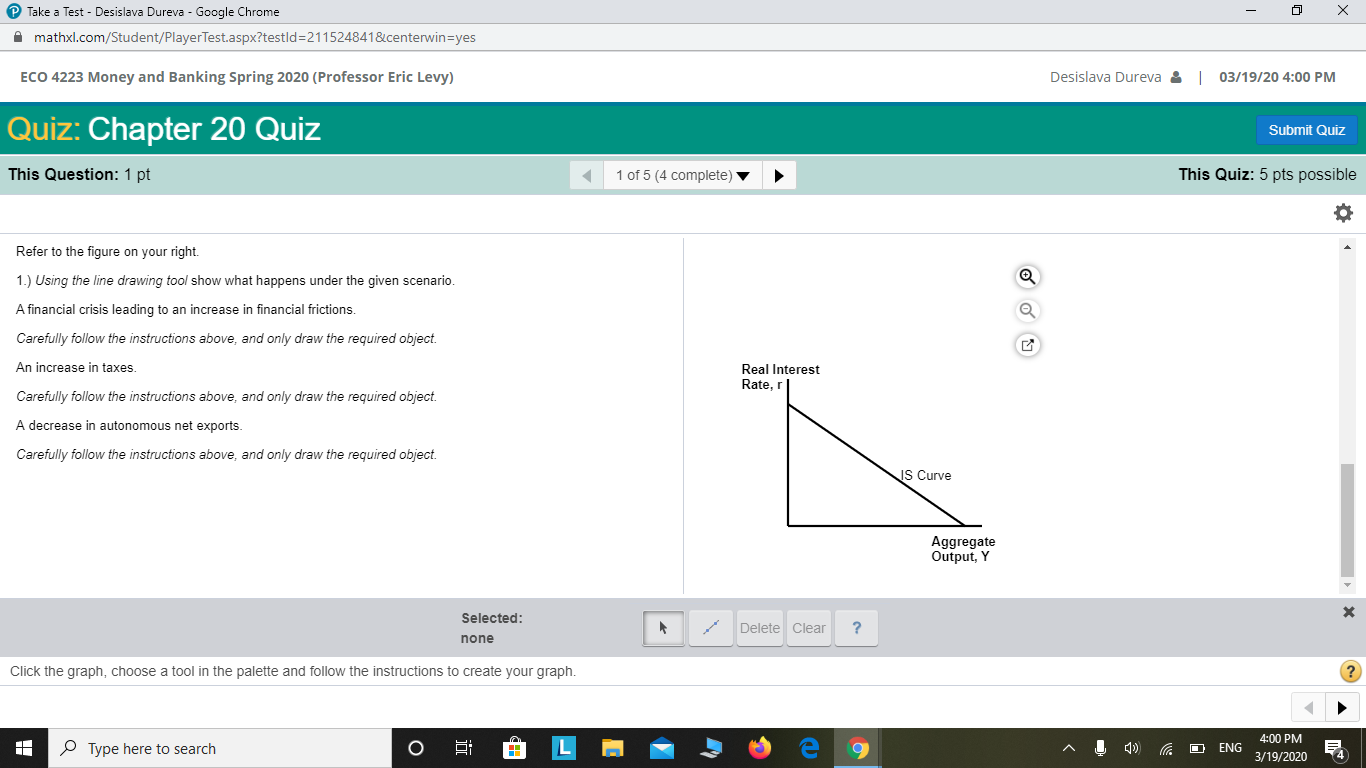
Take a Test - Desislava Dureva - Google Chrome - X mathxl.com/Student/PlayerTest.aspx?testld=211524841¢erwin=yes ECO 4223 Money and Banking Spring 2020 (Professor Eric Levy) Desislava Dureva & | 03/19/20 4:00 PM Quiz: Chapter 20 Quiz Submit Quiz This Question: 1 pt 4 1 of 5 (4 complete) This Quiz: 5 pts possible Refer to the figure on your right. 1.) Using the line drawing tool show what happens under the given scenario. A financial crisis leading to an increase in financial frictions Carefully follow the instructions above, and only draw the required object. An increase in taxes. Real Interest Carefully follow the instructions above, and only draw the required object. Rate, r A decrease in autonomous net exports. Carefully follow the instructions above, and only draw the required object. IS Curve Aggregate Output, Y Selected: X none Delete Clear Click the graph, choose a tool in the palette and follow the instructions to create your graph. ? Type here to search O L 9 4:00 PM 3/19/2020
Step by Step Solution
There are 3 Steps involved in it

Get step-by-step solutions from verified subject matter experts