

Question: TAKE SCREENSHOTS FROM SOLIDWORKS AND COMSOL. Take screenshots from solidworks and COMSOL and paste in to a word file. Then print the word file and
TAKE SCREENSHOTS FROM SOLIDWORKS AND COMSOL.
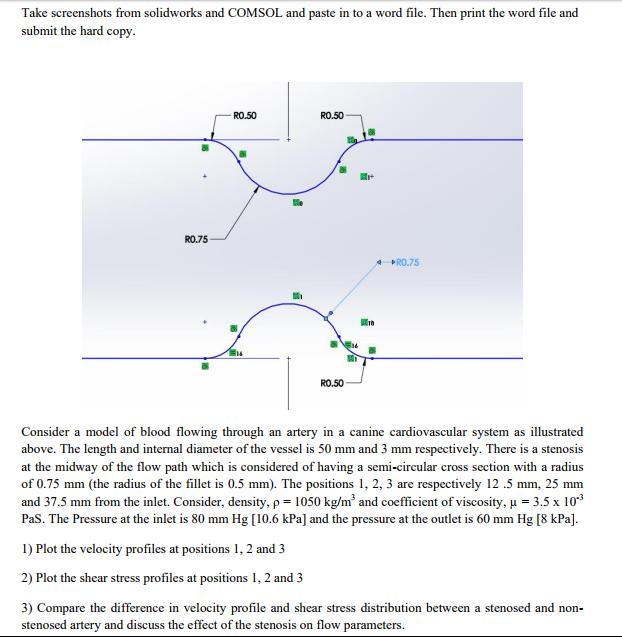
Take screenshots from solidworks and COMSOL and paste in to a word file. Then print the word file and submit the hard copy RO.50 R0.50 RO.75 4 RO.75 10 RO.50 Consider a model of blood flowing through an artery in a canine cardiovascular system as illustrated above. The length and internal diameter of the vessel is 50 mm and 3 mm respectively. There is a stenosis at the midway of the flow path which is considered of having a semi-circular cross section with a radius of 0.75 mm (the radius of the fillet is 0.5 mm). The positions 1, 2, 3 are respectively 12.5 mm, 25 mm and 37.5 mm from the inlet. Consider, density, 1050 kg/m 3 and coefficient of viscosity, -3.5 x 10.3 PaS. The Pressure at the inlet is 80 mm Hg [10.6 kPa] and the pressure at the outlet is 60 mm Hg [8 kPa]. 1) Plot the velocity profiles at positions 1, 2 and 3 2) Plot the shear stress profiles at positions 1, 2 and 3 3) Compare the difference in velocity profile and shear stress distribution between a stenosed and non- Take screenshots from solidworks and COMSOL and paste in to a word file. Then print the word file and submit the hard copy RO.50 R0.50 RO.75 4 RO.75 10 RO.50 Consider a model of blood flowing through an artery in a canine cardiovascular system as illustrated above. The length and internal diameter of the vessel is 50 mm and 3 mm respectively. There is a stenosis at the midway of the flow path which is considered of having a semi-circular cross section with a radius of 0.75 mm (the radius of the fillet is 0.5 mm). The positions 1, 2, 3 are respectively 12.5 mm, 25 mm and 37.5 mm from the inlet. Consider, density, 1050 kg/m 3 and coefficient of viscosity, -3.5 x 10.3 PaS. The Pressure at the inlet is 80 mm Hg [10.6 kPa] and the pressure at the outlet is 60 mm Hg [8 kPa]. 1) Plot the velocity profiles at positions 1, 2 and 3 2) Plot the shear stress profiles at positions 1, 2 and 3 3) Compare the difference in velocity profile and shear stress distribution between a stenosed and non
Step by Step Solution
There are 3 Steps involved in it

Get step-by-step solutions from verified subject matter experts