

Question: Take some time to study this figure and that on the following page of changing energy use in the U.S. over time. Each version uses


Take some time to study this figure and that on the following page of changing energy use in the U.S. over time. Each version uses different data?quads for the graph below, and percentage share on the next page. A source of debate among experts is how to divide this graph into distinct periods when energy transitions occurred. It is simple enough to identify the era when wood (biomass) was king and when the transition to coal began in the late 19th century. But how long did this transition last? How to define when a transition ends? Your task here is to decide how to divide either this graph, or that on the next page, into a series of such transitions, say four or five (no more). Such transitions don't have to involve just single sources but can be based on two or more. Include a basic description of each transition, including how long it lasted.
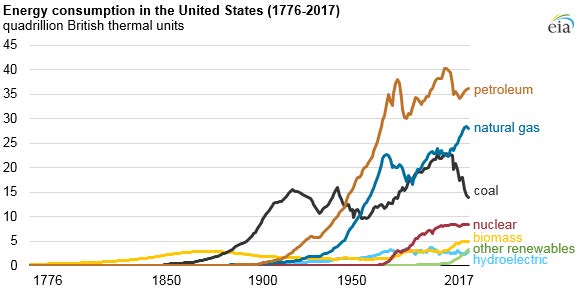
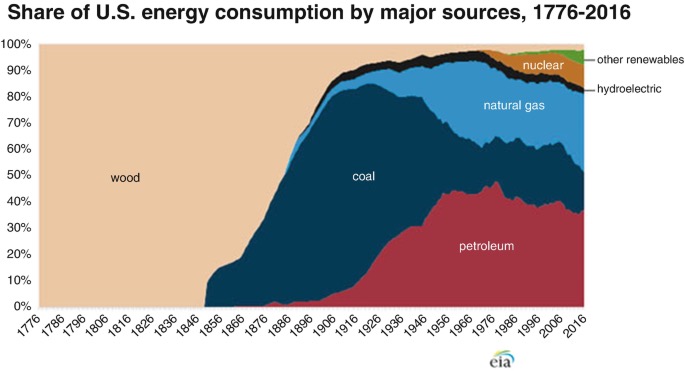
Energy consumption in the United States (1776-2017) quadrillion British thermal units cia 45 40 35 petroleum 30 25 natural gas 20 15 coal 10 nuclear 5 biomass other renewables hydroelectric 1776 1850 1900 1950 2017Share of U.S. energy consumption by major sources, 1776-2016 100% 90% nuclear other renewables 80% hydroelectric 70% natural gas 60% 50% wood coal 40% 30% 20% petroleum 10% 0% 1776 1786 796 306 17 1816 18 1826 1836 18 1856 1866 1876 1886 96 06 16 926 1936 18 19 1946 19 1966 1976 1986 1996 2006 2016 cia
Step by Step Solution
There are 3 Steps involved in it

Get step-by-step solutions from verified subject matter experts