

Question: Take-Home Problem Set #1 You recently received $1,000,000 because you were the 1,000,000th person to purchase a 20- 3. ounce Sprite Zero. You want to
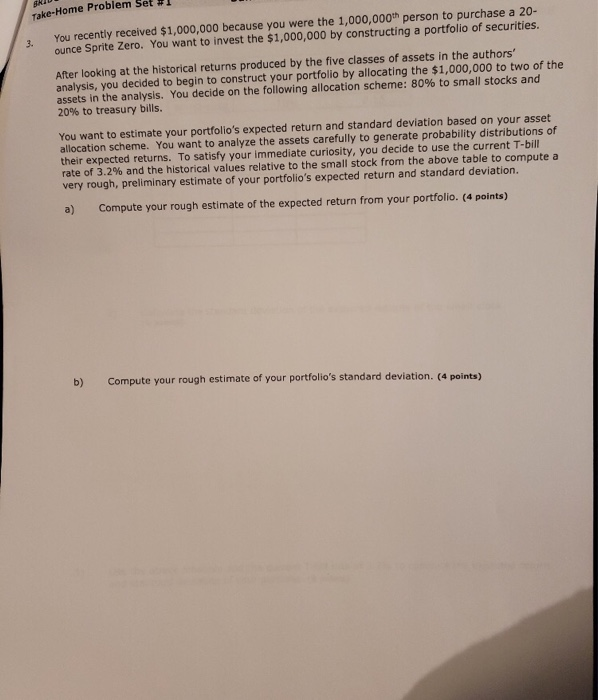
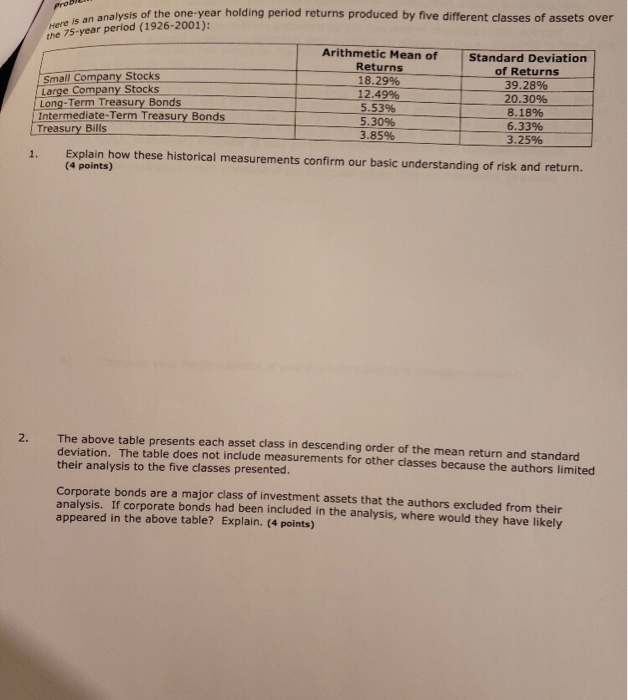
Take-Home Problem Set #1 You recently received $1,000,000 because you were the 1,000,000th person to purchase a 20- 3. ounce Sprite Zero. You want to invest the $1,000,000 by constructing a portfolio of securities. After looking at the historical returns produced by the five classes of assets in the authors analysis, you decided to begin to construct your portfolio by allocating the $1,000,000 to two of the assets in the analysis. You decide on the following allocation scheme: 80 % to small stocks and 20% to treasury bills. You want to estimate your portfolio's expected return and standard deviation based on your asset allocation scheme. You want to analyze the assets carefully to generate probability distributions of their expected returns. To satisfy your immediate curiosity, you decide to use the current T-bill rate of 3.2% and the historical values relative to the small stock from the above table to compute a very rough, preliminary estimate of your portfolio's expected return and standard deviation. a) Compute your rough estimate of the expected return from your portfolio. (4 points) Compute your rough estimate of your portfolio's standard deviation. (4 points) b) pro Here is an analysis of the one-year holding period returns produced by five different classes of assets over the 75-year period (1926-2001): Arithmetic Mean of Returns 18.29% 12.49% Standard Deviation of Returns Small Company Stocks Large Company Stocks Long-Term Treasury Bonds Intermediate-Term Treasury Bonds 39.28% 20.30% 8.18% 5.53% 5.30% 6.33% 3.25% Treasury Bills 3.85% Explain how these historical measurements confirm our basic understanding of risk and return. (4 points) 1. The above table presents each asset class in descending order of the mean return and standard deviation. The table does not include measurements for other classes because the authors limited their analysis to the five classes presented. Corporate bonds are a major class of investment assets that the authors excluded from their analysis. If corporate bonds had been included in the analys is, where wou ld they have likely appeared in the above table? Explain. (4 points)
Step by Step Solution
There are 3 Steps involved in it

Get step-by-step solutions from verified subject matter experts