

Question: Taking the picture below as the reference stock, please compare it with the 2 other stocks above it. Please intepret the candlestick analysis and explain
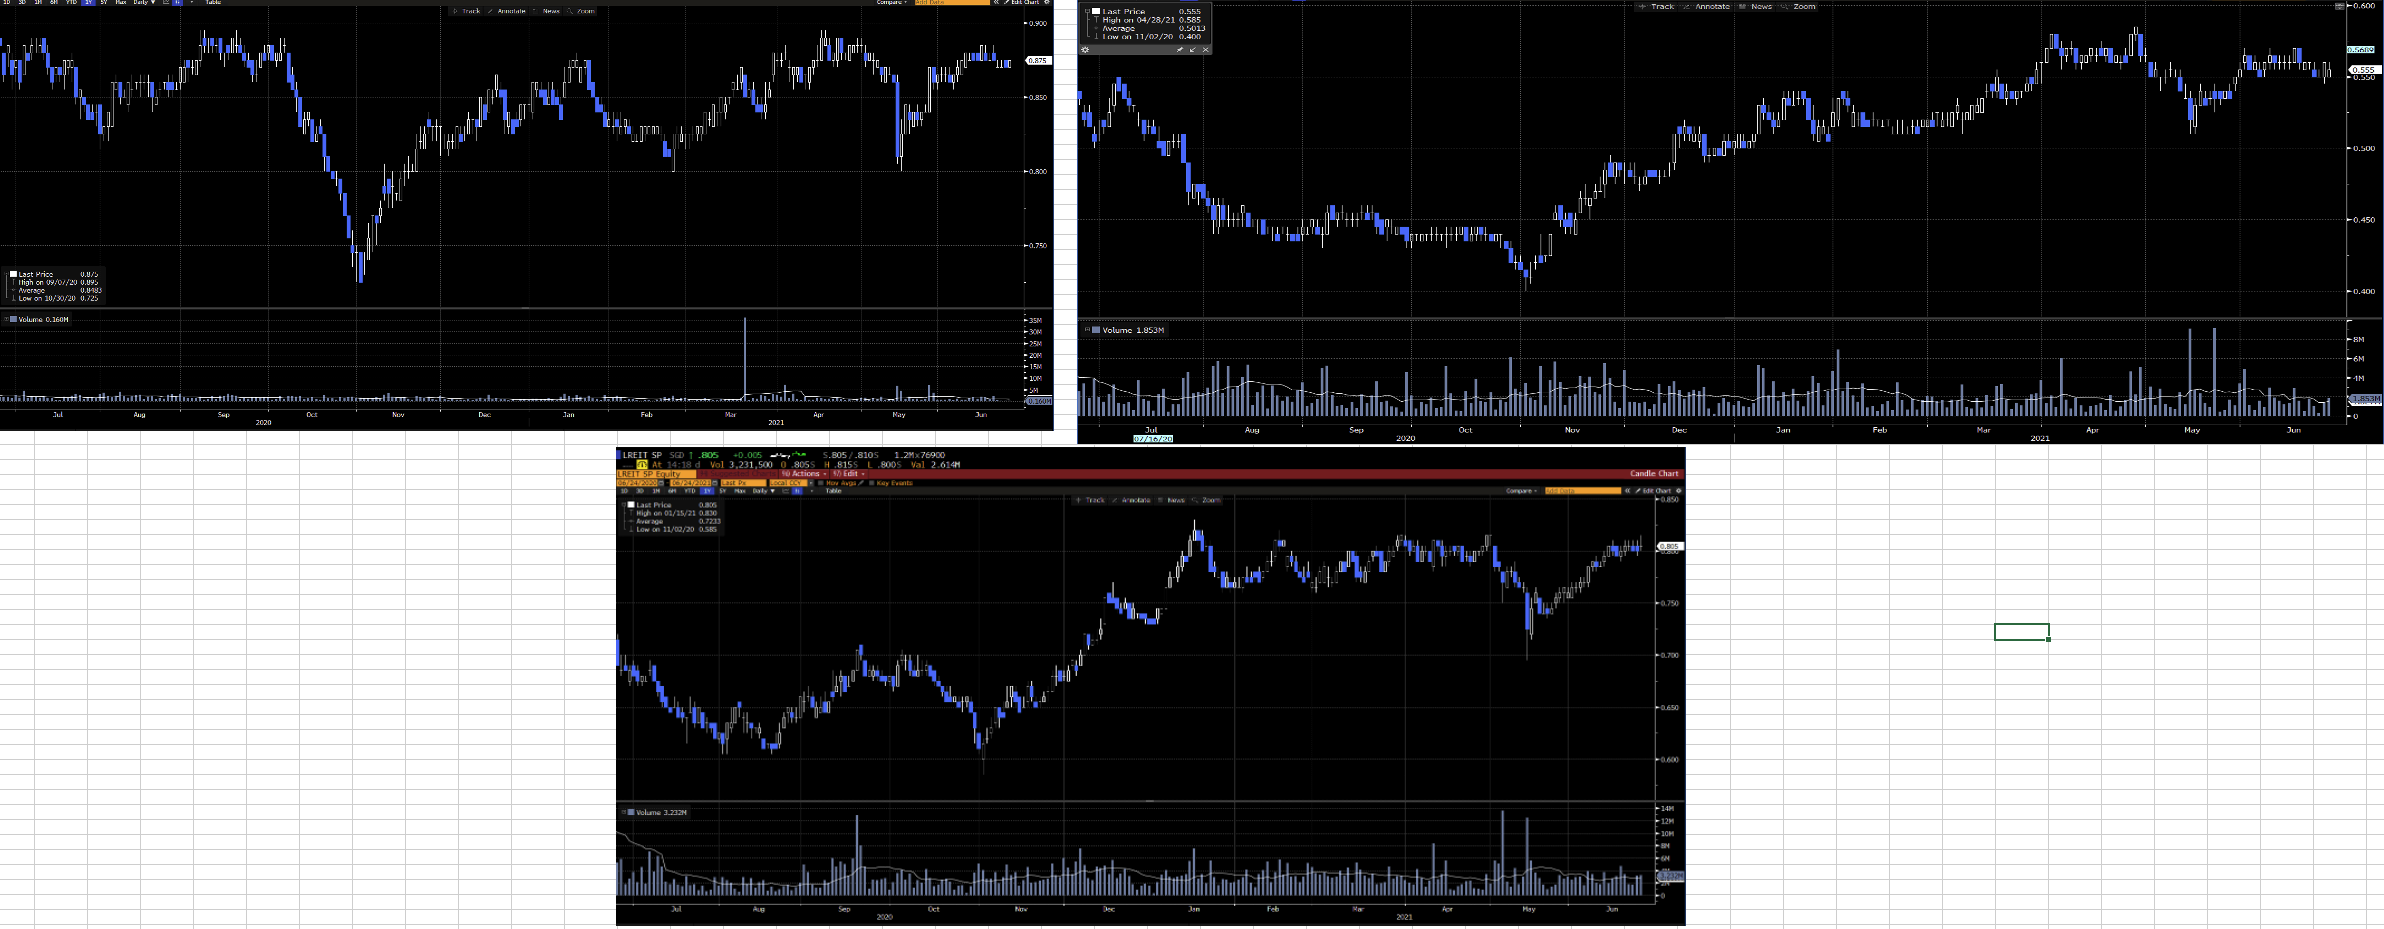 Taking the picture below as the reference stock, please compare it with the 2 other stocks above it.
Please intepret the candlestick analysis and explain what does it mean to your clients.
p.s im very sorry for the small photos, apologies : . Track Annotate News Zoom --0,600 Last Price 0.555 T High on 04/28/21 0.585 Average 0.501: I low on 11/07/20 0.400 TIE 0.875 PES 0.850 Vaatalous 1.m/w", . wat apline -0.500 -0.800 -0.450 Last Price 0.0/5 Titigh on 09:04,20 0.195 Average 0.0483 Low on 10/30/20 0.225 -0.400 Volume 0.160M 35M Volume 1.953M SM 25M -6N 15M - 10M -M muttautudutaatit TRIMITE mutualto -0.60M www. Jur 2021 Oct May 2021 Candle Chart LREIT SP SGD 1 .805 +0.005 1.2MX76900 At 14:18 d Vol 3,231,500 0.8055 H.8155 L .8005 Val 2.6144 LREIT 5P quity 90 Actions Edit 30 NGHYD YN Last Price T High on 03/35/21 0.330 Avere 0.7233 Low on 11/02/20 OSS de Chart hildegyptis volume 3.232
Step by Step Solution
There are 3 Steps involved in it

Get step-by-step solutions from verified subject matter experts