

Question: Target Horizontal Analysis - Income Statement https://www.nasdaq.com/symbol/tgt/financials?query=income-statement Values in (000s) Current Assets Total Revenue Cost of Revenue Gross Profit Period Ending: 2/3/2018 1/28/2017 Increase or
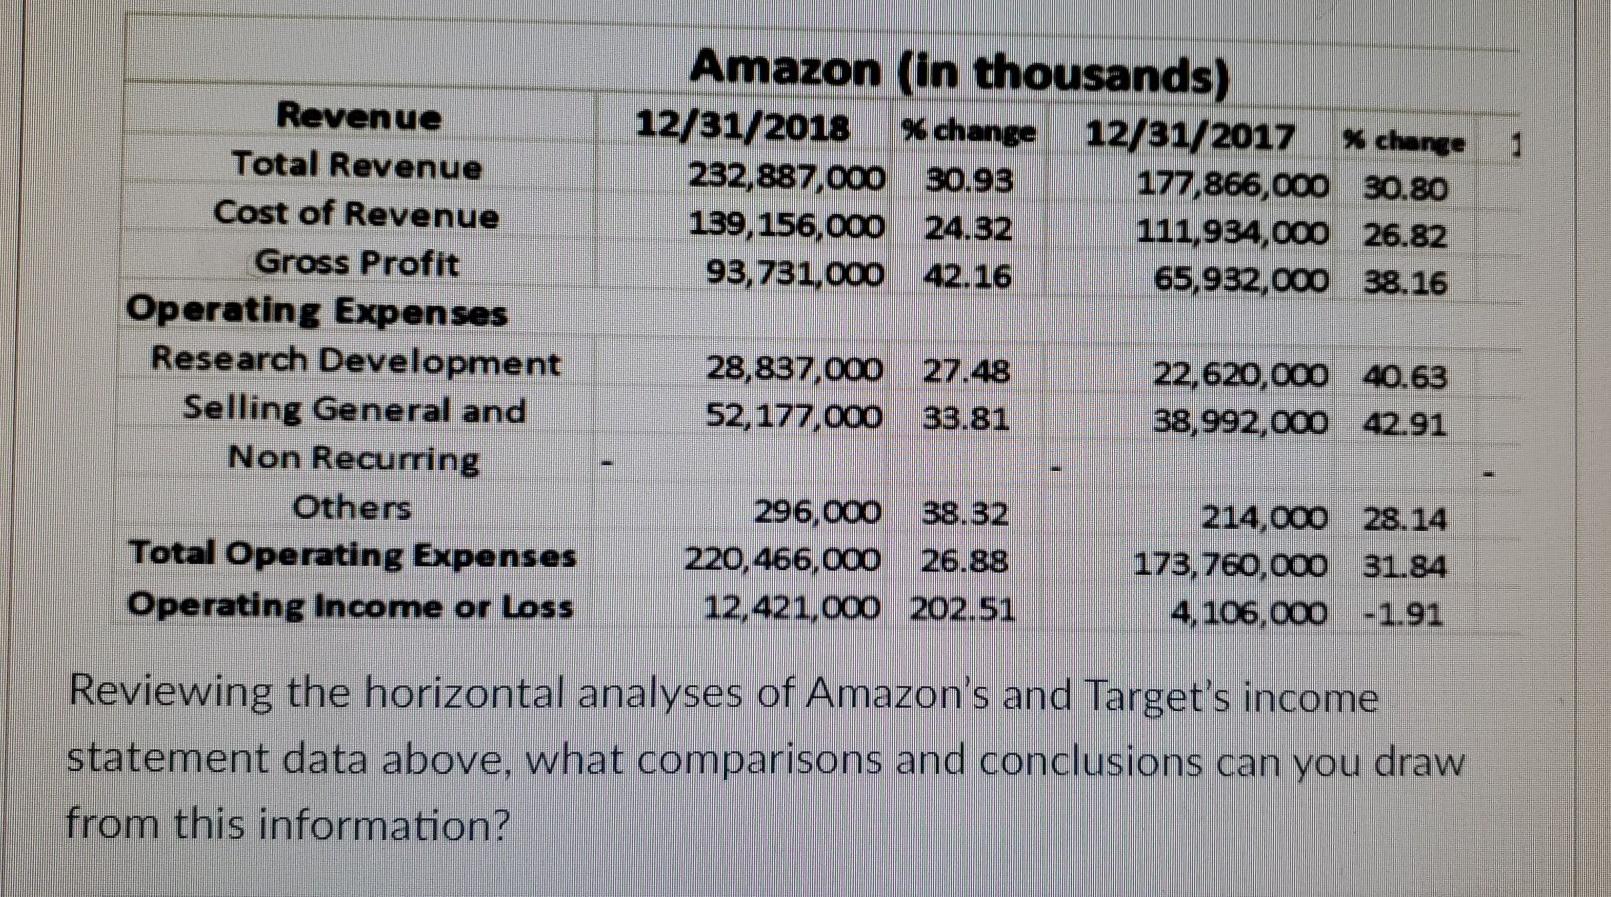
Target Horizontal Analysis - Income Statement https://www.nasdaq.com/symbol/tgt/financials?query=income-statement Values in (000s) Current Assets Total Revenue Cost of Revenue Gross Profit Period Ending: 2/3/2018 1/28/2017 Increase or Decrease) Amount Percent $71,879,000 $69.495.000 $2,384,000 3.3% $51.125.000 $49 145.000 $1.980.000 3.90 $20,754,000 $20,350,000 $404,000 1.9% Operating Expenses Research and Development Sales, General and Admin. Non-Recurring Items Other Operating Items Operating Income Add'l income/expense items $0 $0 0.0% $14.248,000 $13.356.000 $892.000 6.3% $0 0$ 0.09 $2.194.000 $2,025,000 $169,000 7.7% $4.312,000 $4,969,000 $0 -$657,000 -15.2% $0 So 0.096 Earnings Before Interest and Tax $4.3 12.000 Interest Expense $4.969,000 5666.000 $1,004,000 -$657,000 -15.2% -$338,000 -50.8% Earnings Before Tax $3.646.000 $3.965,000 -$319,000 -8.796 Income Tax Minority Interest Equity Earnings/Loss Unconsolidated Subsidiary $718.000 $1,296,000 -$578.000 -80.5% $0 SO 0.0% $0 50 $0 0.004 Net Inocome-Cont. Operations $2.928.000 $2,669,000 $259,000 8.8% Net Income $2,934,000 $2,737,000 $197.000 6.7% Net Income Applicable to Common Shareholders $2.934.000 $2,737,000 $197,000 16.7% Revenue Total Revenue Cost of Revenue Gross Profit Operating Expenses Amazon (in thousands) 12/31/2018 % change 12/31/2017 12/31/2017 232,887,000 30.93 177,866,000 % change 30.80 1 139,156,000 24.32 111,934,000 26.82 93,731,000 42.16 65,932,000 38.16 Research Development 28,837,000 27.48 Selling General and 52,177,000 33.81 22,620,000 40.63 38,992,000 42.91 Non Recurring Others Total Operating Expenses 296,000 38.32 220,466,000 26.88 12,421,000 202.51 214,000 28.14 173,760,000 31.84 4,106,000 -1.91 Operating Income or Loss Reviewing the horizontal analyses of Amazon's and Target's income statement data above, what comparisons and conclusions can you draw from this information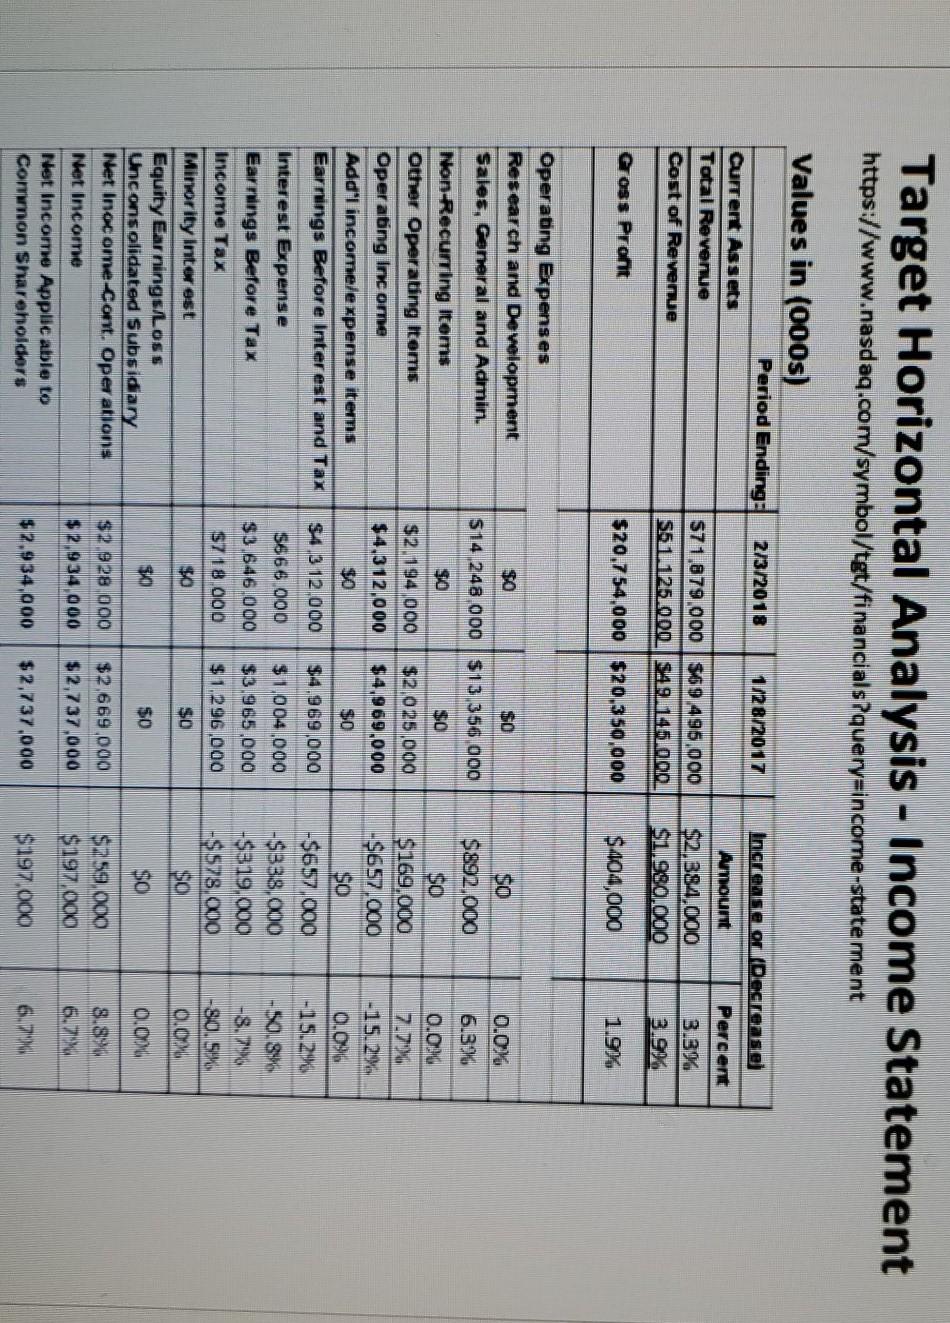
Step by Step Solution
There are 3 Steps involved in it

Get step-by-step solutions from verified subject matter experts