

Question: tarleton.instructure.com C + 88 Dashboard Quiz: Exam 3 Spring 2022 For this sample, t*df = Home Announcements The 95% CI = ( Grades NOTE: Report


![4A- t*df Work In the PsyStat calculator: Distribution: [ Select ] A](https://s3.amazonaws.com/si.experts.images/answers/2024/06/6674c495f31d1_5336674c495cac9d.jpg)
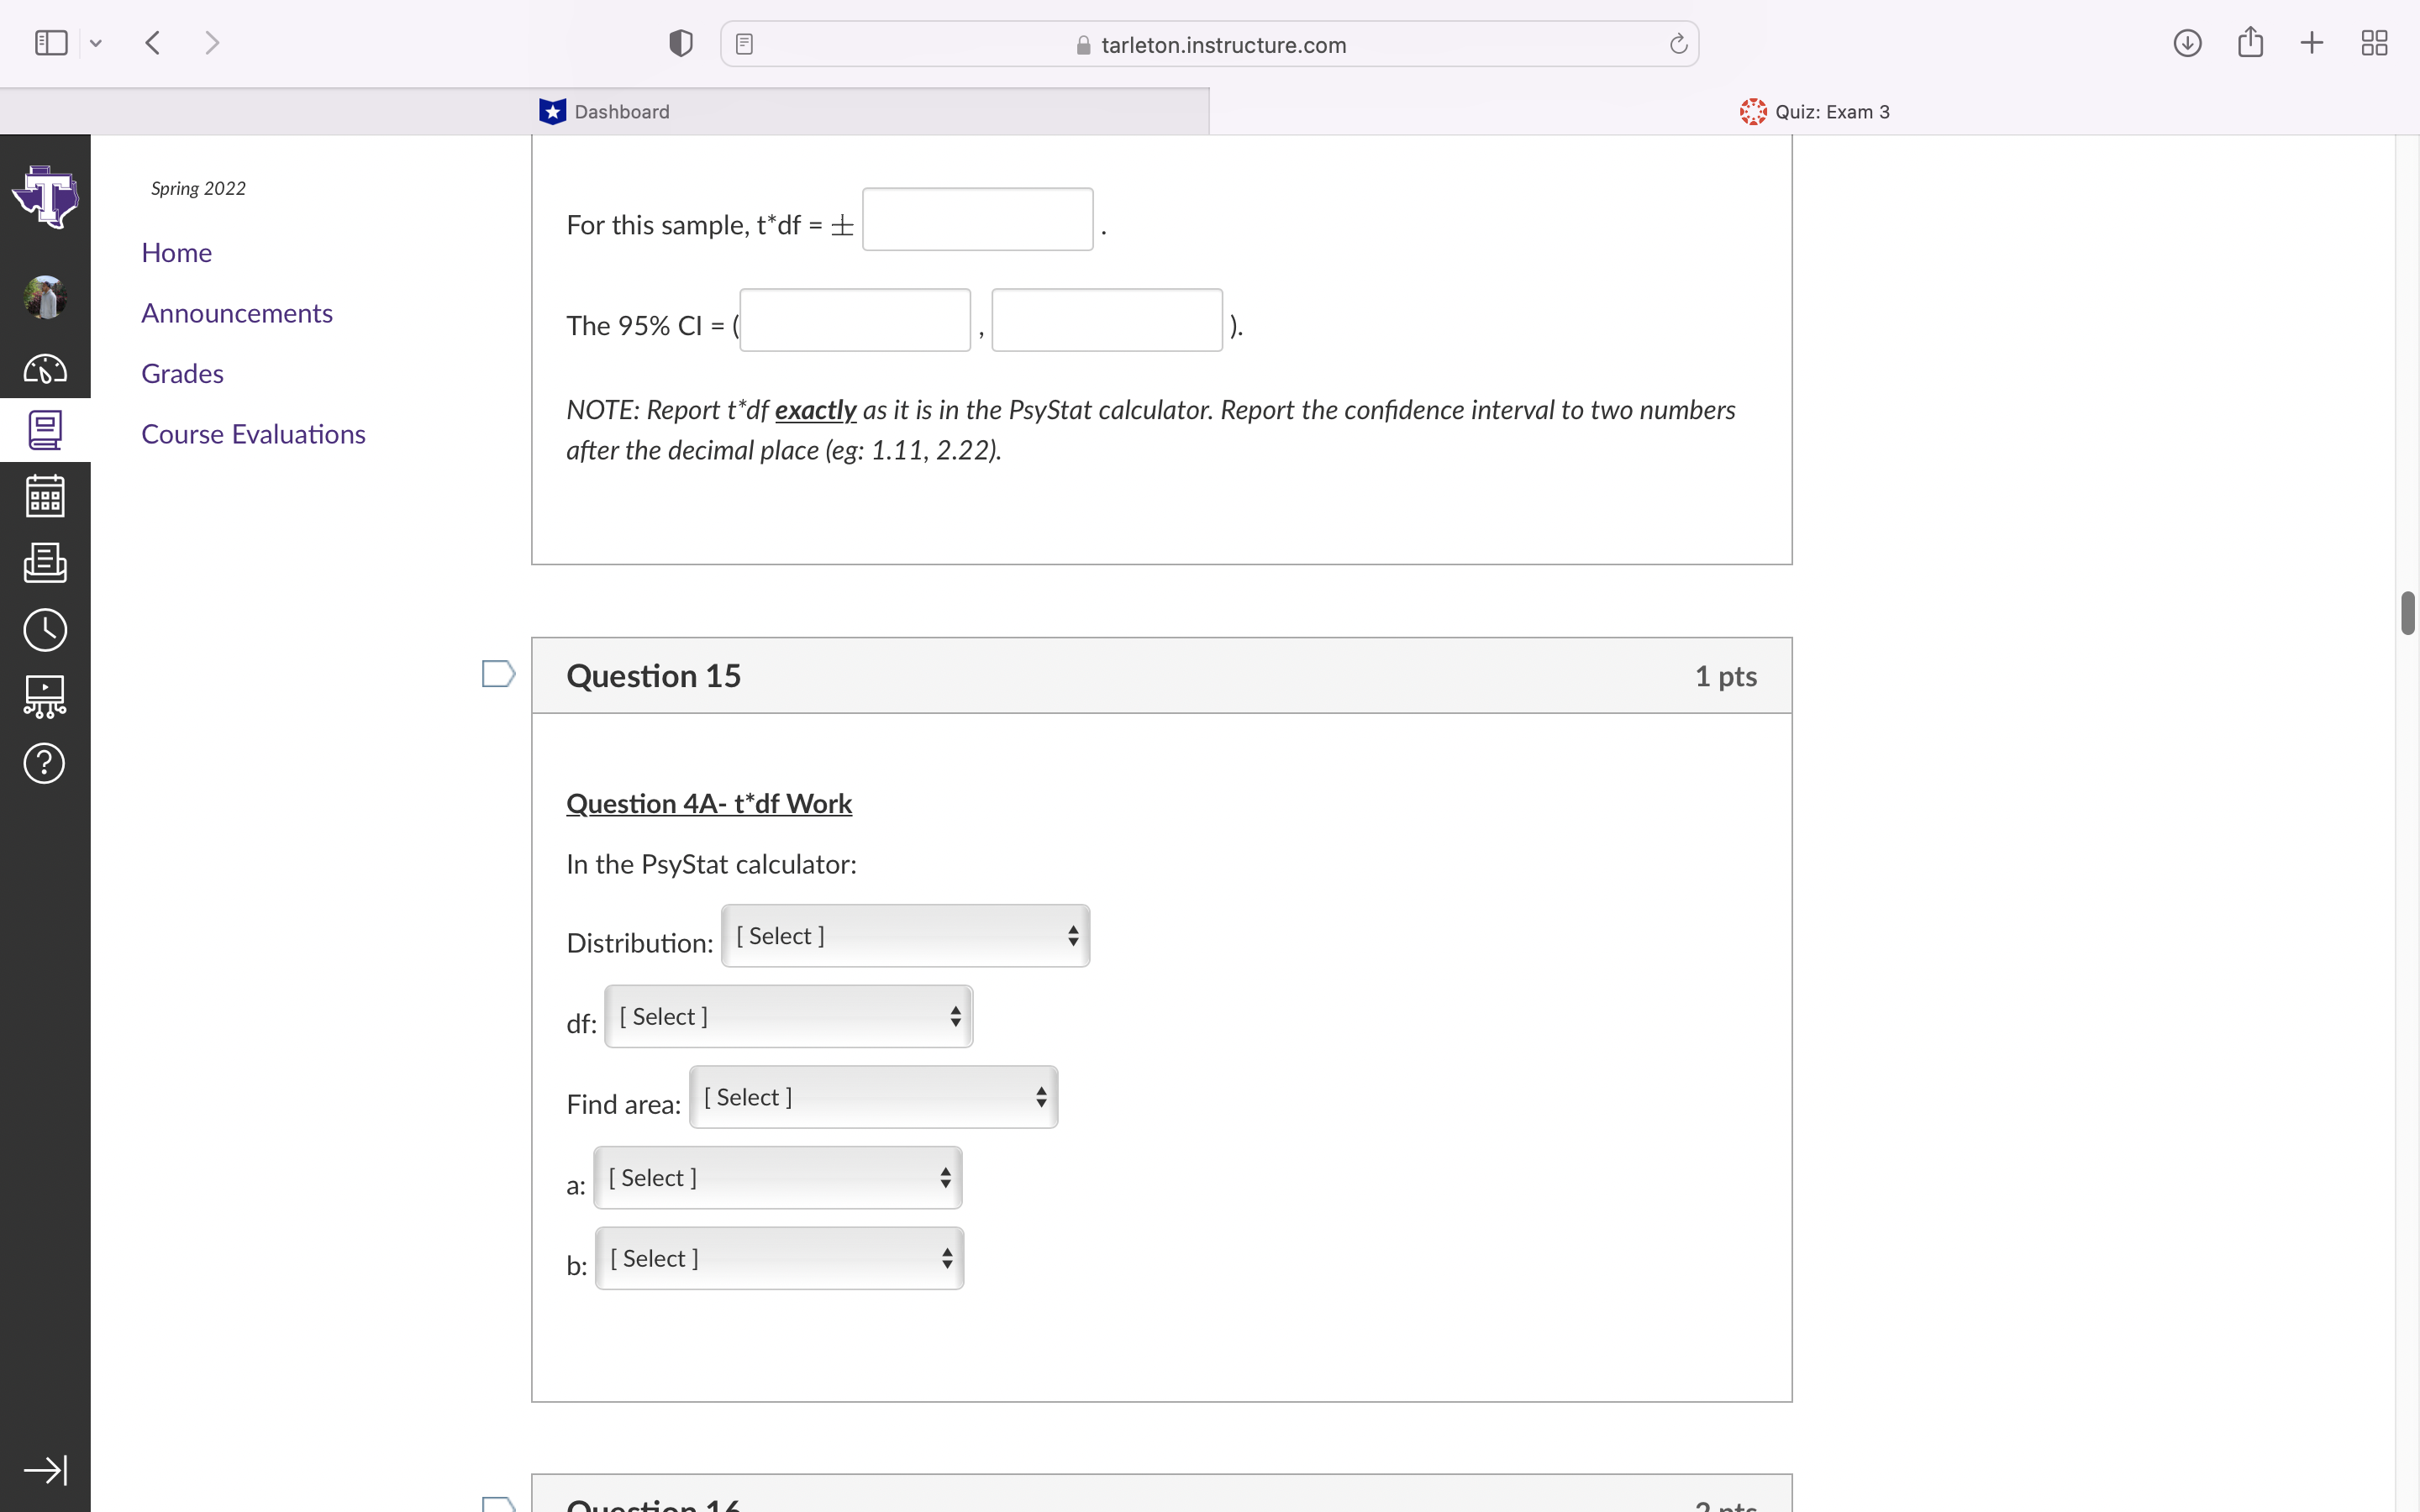
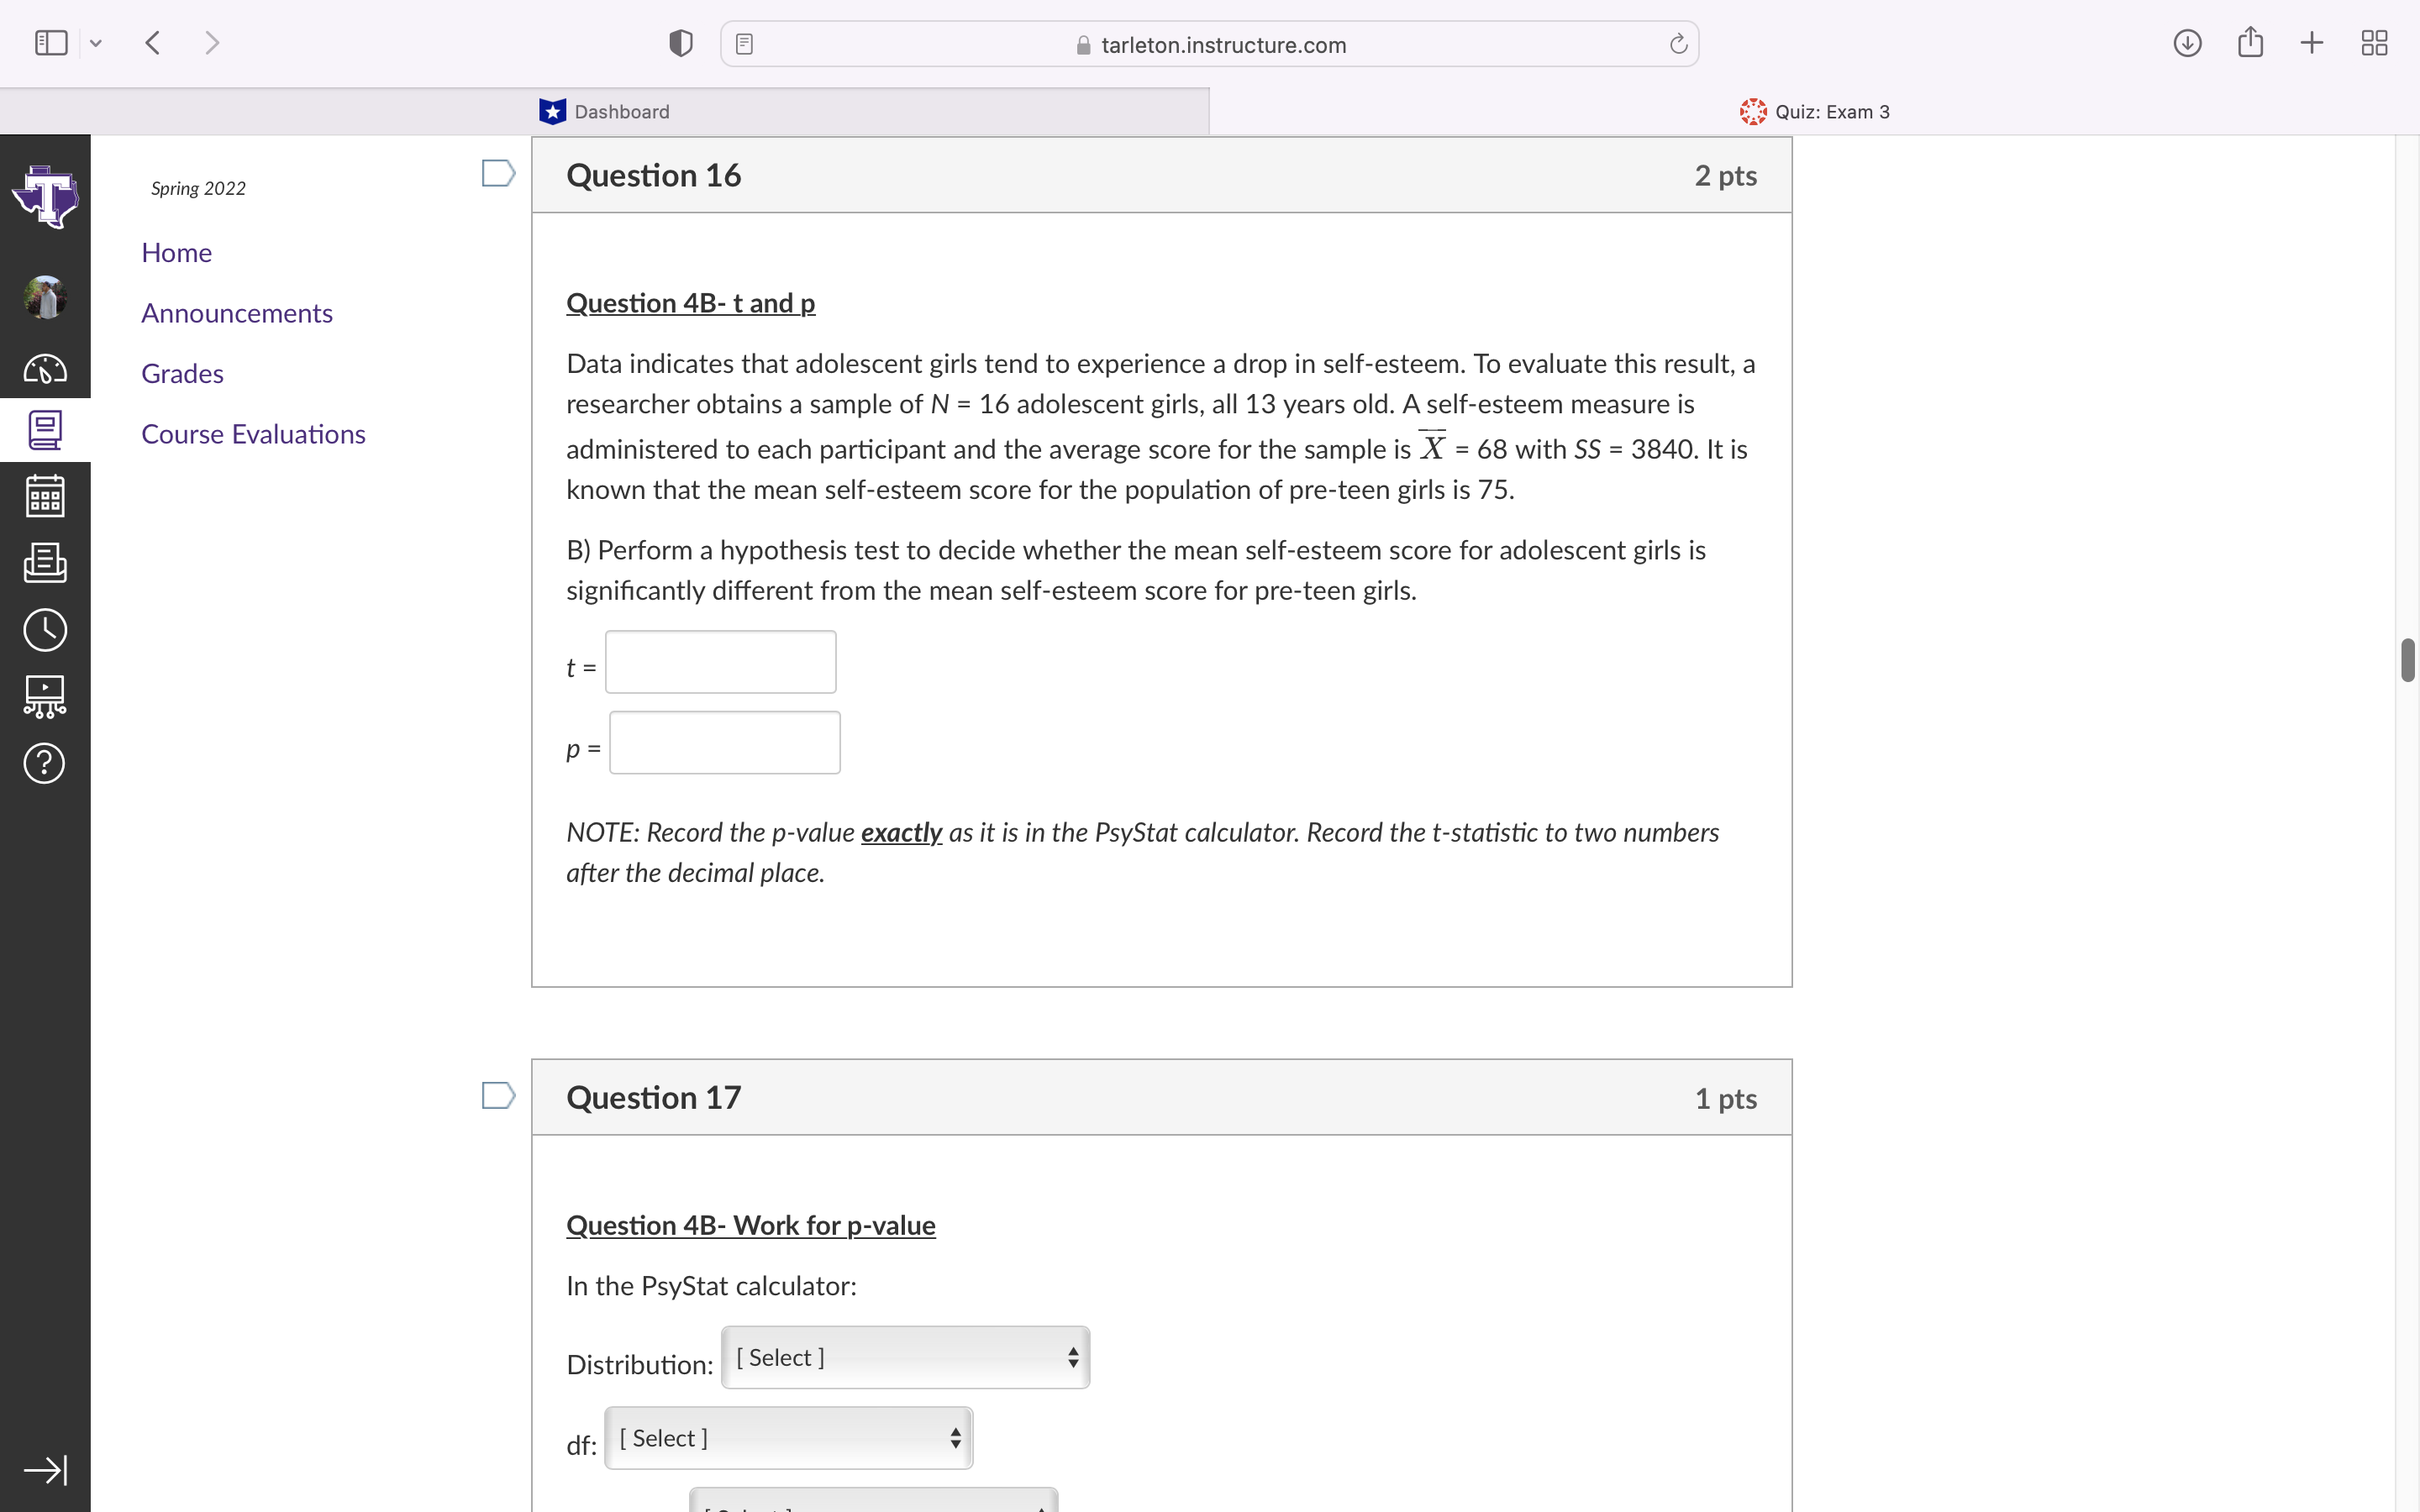
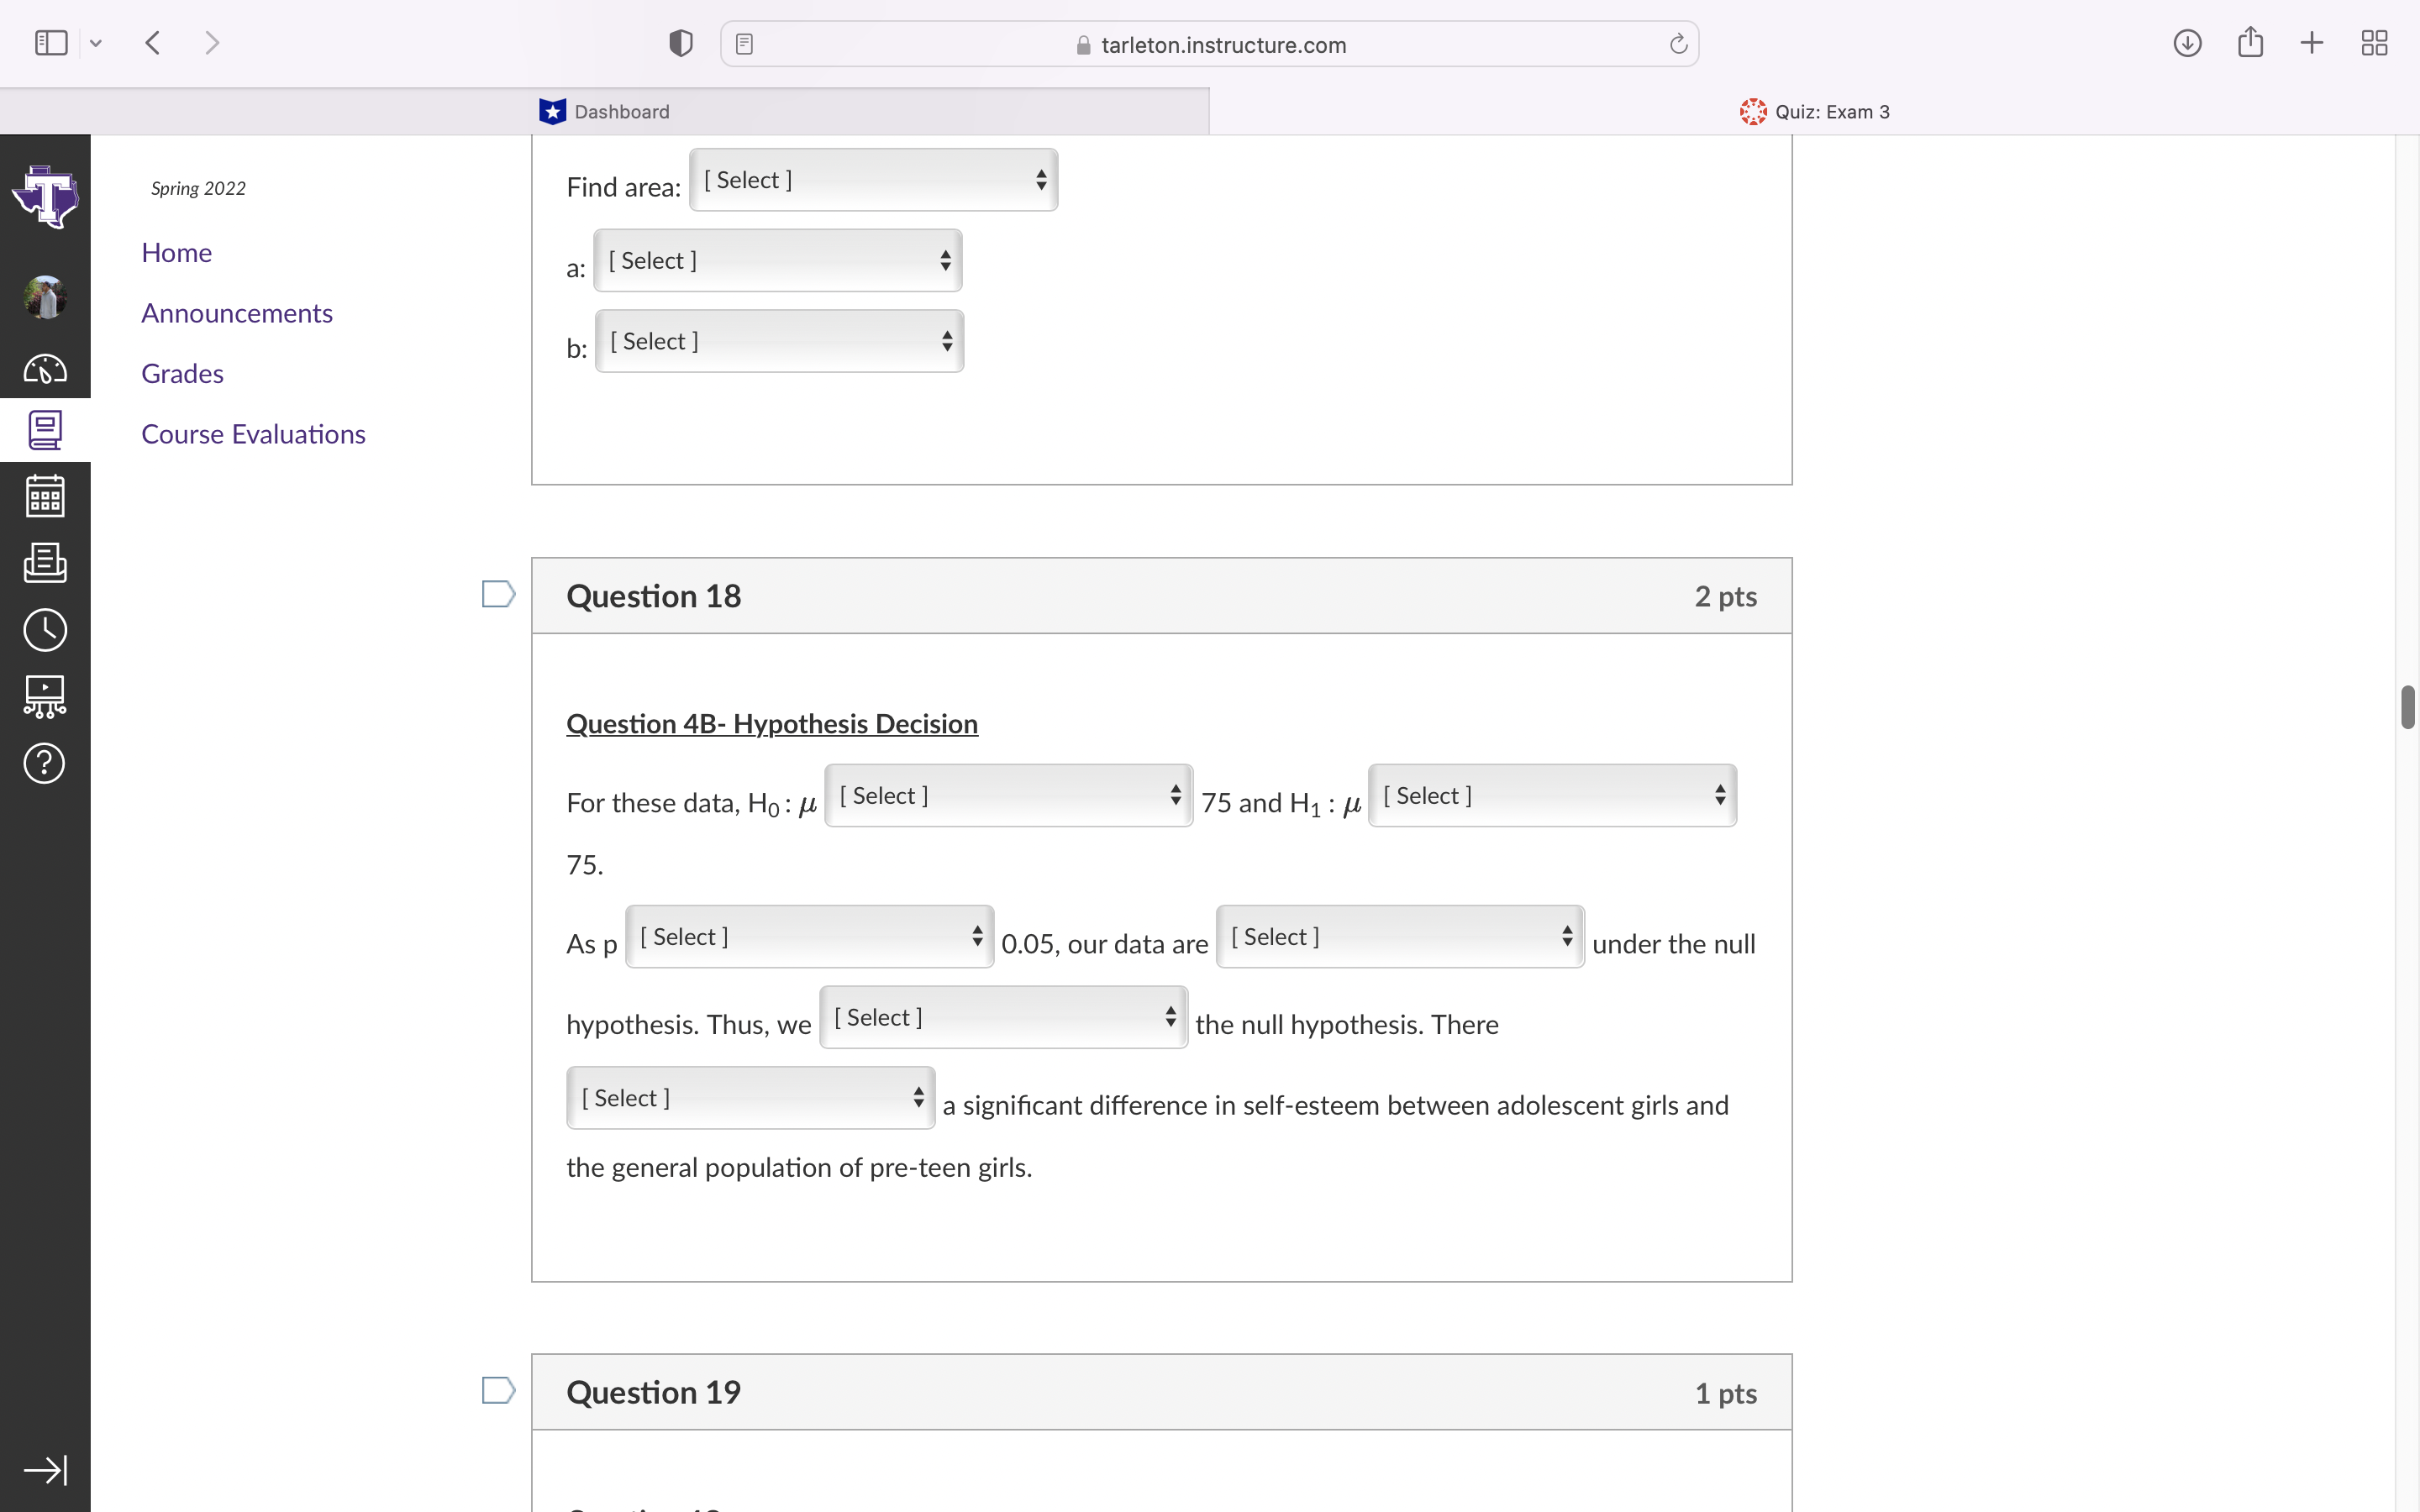
tarleton.instructure.com C + 88 Dashboard Quiz: Exam 3 Spring 2022 For this sample, t*df = Home Announcements The 95% CI = ( Grades NOTE: Report t*df exactly as it is in the PsyStat calculator. Report the confidence interval to two numbers Course Evaluations after the decimal place (eg: 1.1 1, 2.22). Eh D Question 15 1 pts ? Question 4A- t*df Work In the PsyStat calculator: Distribution: [ Select ] A df: [ Select ] Find area: [ Select ] [ Select ] b: [ Select ]tarleton.instructure.com C + 88 Dashboard Quiz: Exam 3 D Spring 2022 Question 16 2 pts Home Announcements Question 4B- t and p Grades Data indicates that adolescent girls tend to experience a drop in self-esteem. To evaluate this result, a researcher obtains a sample of N = 16 adolescent girls, all 13 years old. A self-esteem measure is Course Evaluations administered to each participant and the average score for the sample is X = 68 with SS = 3840. It is known that the mean self-esteem score for the population of pre-teen girls is 75. Eh B) Perform a hypothesis test to decide whether the mean self-esteem score for adolescent girls is significantly different from the mean self-esteem score for pre-teen girls. t = ? p = NOTE: Record the p-value exactly as it is in the PsyStat calculator. Record the t-statistic to two numbers after the decimal place. D Question 17 1 pts Question 4B- Work for p-value In the PsyStat calculator: Distribution: [ Select ] df: [ Select ]Spring 2022 Home Announcements Grades Course Evaluations u Dashboard U E E '(arletonjnstructure'com CD 0 Find area: l Select l 0 a: [ Select] 0 b: [Select ] ~33! Quiz: Exam 3 Question 18 2 pts Question 4B Hypothesis Decision 4 For these data, Ho: [1 [59'9\"] 6 175 and H1:,u [59'5\"] 75. As p [Select] c 005, our data are [59'5\"] 9 under the null 9 the null hypothesis. There hypothesis. Thus, we [Select] [56'9\"] a signicant difference in self-esteem between adolescent girls and the general population of pre-teen girls. Question 19 1 pts
Step by Step Solution
There are 3 Steps involved in it

Get step-by-step solutions from verified subject matter experts