

Question: Task 1. Chapter 1. Data Consider How many observations does the data have? ???How many variables does the data have? ???Describe the data. For example,
Task 1. Chapter 1. Data Consider
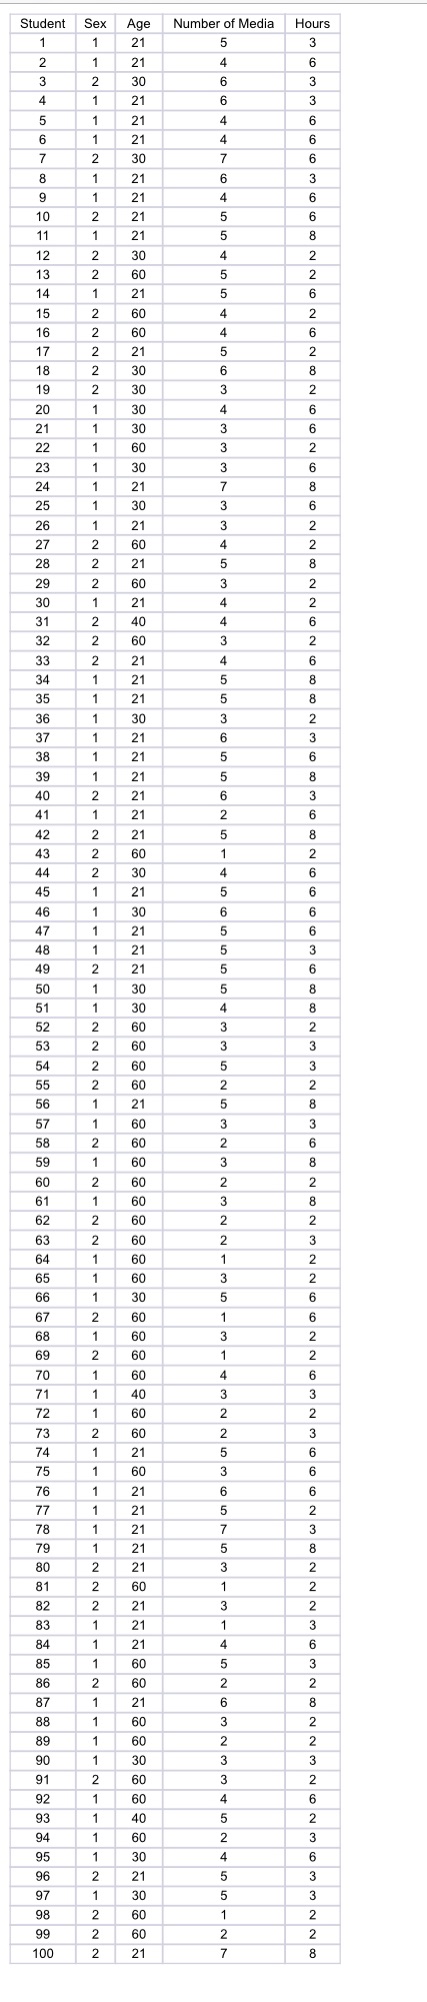
How many observations does the data have? ???How many variables does the data have? ???Describe the data. For example, what is the meaning of the first row, second row, or every row of data
Task 2. Chapter 3. Measures
a) Calculate the mean variables: "Age", "Number of Media", and "Hours" ???Calculate the median of variables: "Age", "Number of Media", and "Hours" ???Calculate the mode of variables: "Age", "Number of Media", and "Hours"
Task 3. Chapter 3. Measures Consider the feedback of projects I and 2 and provide your final updated answer(s). The feedback for projects I and 2 is under your grade for these Droleces. Consider data "Social media xlsx". For this data: ???Calculate the variance of variables: "Age", "Number of Media", and "Hours" ???Calculate the Q1, Q2, and Q3 quartiles of variables: "Age", "Number of Media", and?"Hours"
Task 4. Chapter 4. Visualization Consider the feedback of Project I and provide your final updated answer(s). The feedback for projects I and 2 is under your grade for these projecis. Consider data "Social media xls". For this data: ???Draw a scatter diagram for variables "Number of Media" and "Hours" ???Draw a scatter diagram for variables "Age" and "Hours". ???Draw a scatter diagram for variables "Number of Media" and "Age"
Task 5. Chapter 5. Histogram and Distribution Consider data "Social media xIsx. For this data: a) Draw a histogram for the variable "Sex" b) Draw a histogram for the variable "Hours" c) Draw a histogram for the variable "Number of Media"
Task 6. Chapter 6. Regression Consider data "Social media xls". Assume the dependent variable (Y) is the "Number of Media" and the independent variable (X) is "Age". a) Find the correlation between these variables b) Find the regression equation c) If the age is 50, predict how many social media a user may use.
Task 7. Chapter 7. Confidence Interval Consider data "Social media.xls". For this data: g) Create a two-tail confidence interval for the variable "Hours". b) Create a right-tail confidence interval for the variable "Age". c) Create a left-tail confidence interval for the variable "Number of Media".
Step by Step Solution
There are 3 Steps involved in it

Get step-by-step solutions from verified subject matter experts