

Question: TASK 1 : Compute candlestick data Candlesticks are a common visualisation used to show the trends in a trading system. The candlesticks show what happens
TASK : Compute candlestick data
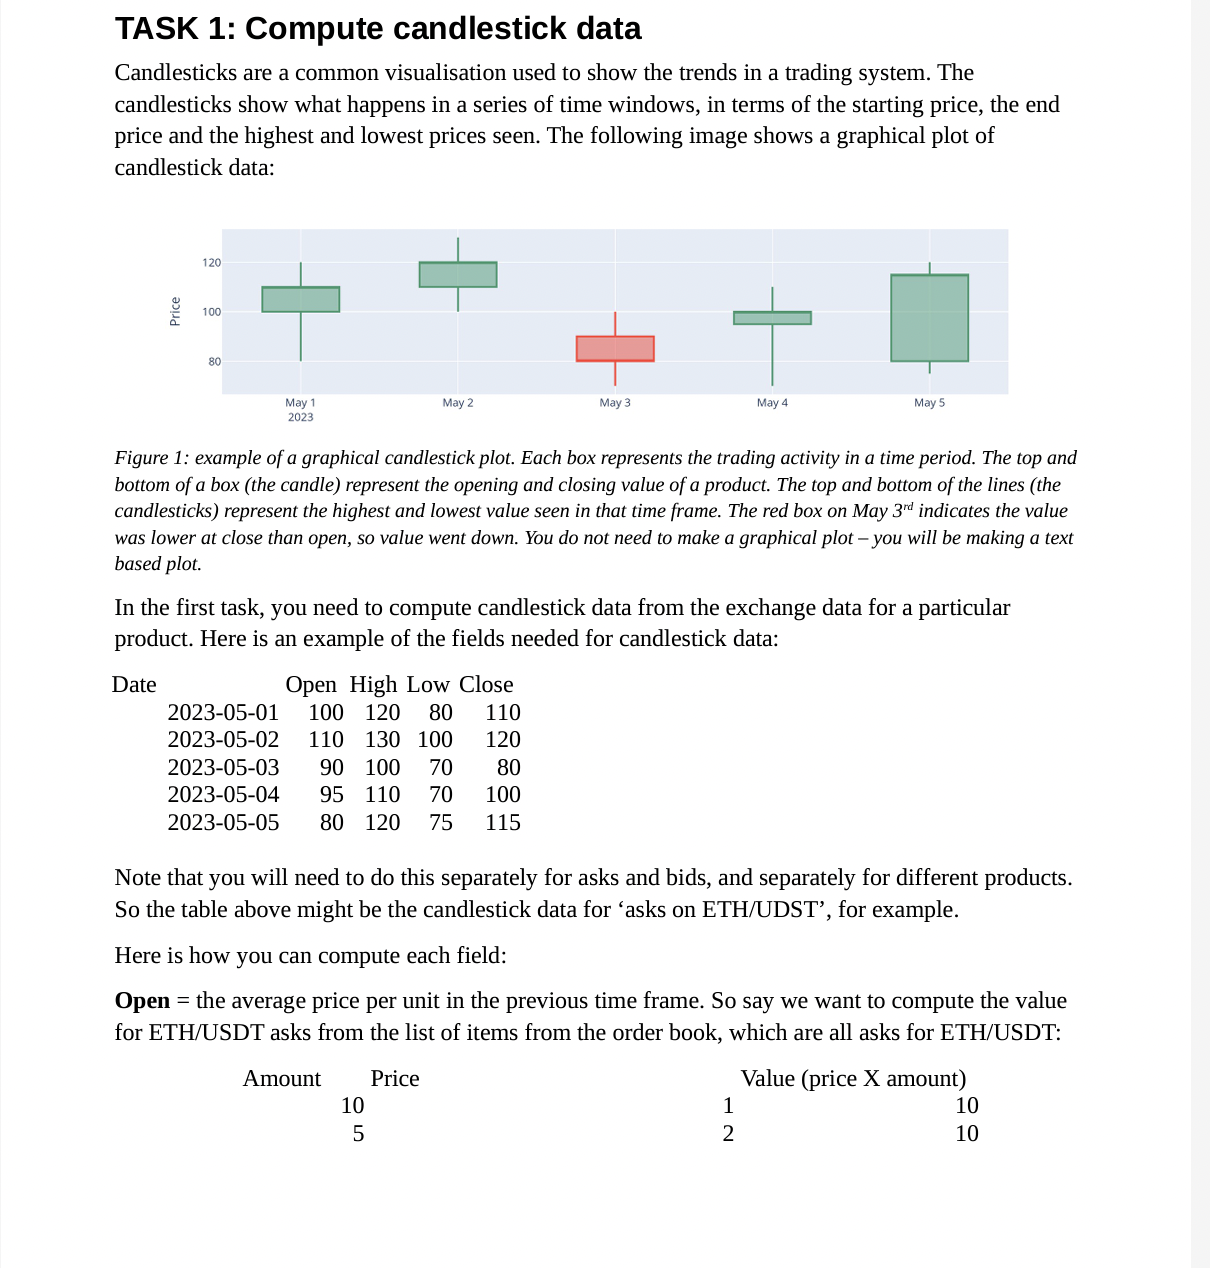
Candlesticks are a common visualisation used to show the trends in a trading system. The
candlesticks show what happens in a series of time windows, in terms of the starting price, the end
price and the highest and lowest prices seen. The following image shows a graphical plot of
candlestick data:
Figure : example of a graphical candlestick plot. Each box represents the trading activity in a time period. The top and
bottom of a box the candle represent the opening and closing value of a product. The top and bottom of the lines the
candlesticks represent the highest and lowest value seen in that time frame. The red box on May indicates the value
was lower at close than open, so value went down. You do not need to make a graphical plot you will be making a text
based plot.
In the first task, you need to compute candlestick data from the exchange data for a particular
product. Here is an example of the fields needed for candlestick data:
Note that you will need to do this separately for asks and bids, and separately for different products.
So the table above might be the candlestick data for 'asks on ETHUDST for example.
Here is how you can compute each field:
Open the average price per unit in the previous time frame. So say we want to compute the value
for ETHUSDT asks from the list of items from the order book, which are all asks for ETHUSDT:
Step by Step Solution
There are 3 Steps involved in it
1 Expert Approved Answer
Step: 1 Unlock

Question Has Been Solved by an Expert!
Get step-by-step solutions from verified subject matter experts
Step: 2 Unlock
Step: 3 Unlock