

Question: Task 1 For this task, download data_Perceptron.txt from Blackboard. This is a simple data set that contains 1000 entries with 2 features and corresponding class
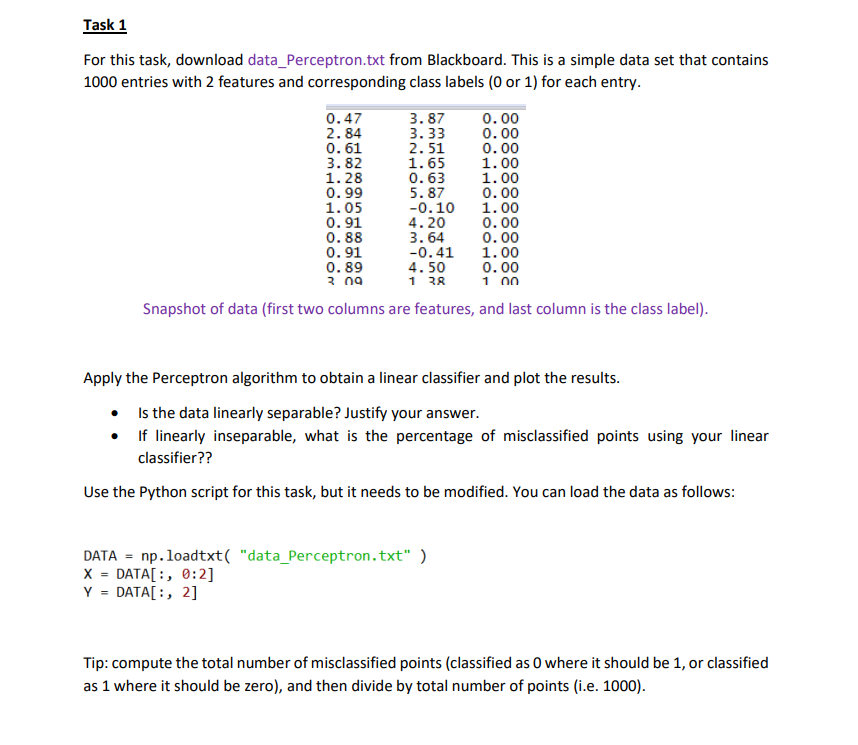
Task 1 For this task, download data_Perceptron.txt from Blackboard. This is a simple data set that contains 1000 entries with 2 features and corresponding class labels ( 0 or 1 ) for each entry. Snapshot of data (first two columns are features, and last column is the class label). Apply the Perceptron algorithm to obtain a linear classifier and plot the results. - Is the data linearly separable? Justify your answer. - If linearly inseparable, what is the percentage of misclassified points using your linear classifier?? Use the Python script for this task, but it needs to be modified. You can load the data as follows: \[ \begin{array}{l} \text { DATA }=n p . \text { loadtxt }(\text { "data_Perceptron.txt" }) \\ X=\text { DATA }[:, 0: 2] \\ Y=\text { DATA }[:, 2] \end{array} \] Tip: compute the total number of misclassified points (classified as 0 where it should be 1 , or classified as 1 where it should be zero), and then divide by total number of points (i.e. 1000)
Step by Step Solution
There are 3 Steps involved in it

Get step-by-step solutions from verified subject matter experts