

Question: Task 1: Project Evaluation You are considering a new product launch. The project will cost $1,000,000, have a five-year life, and have no salvage value;
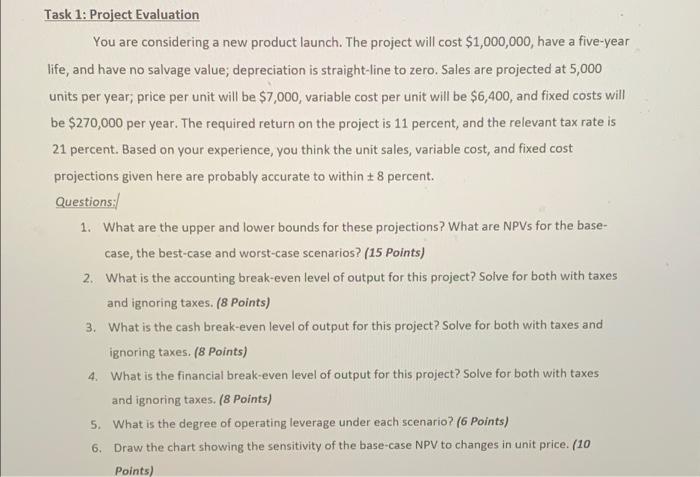
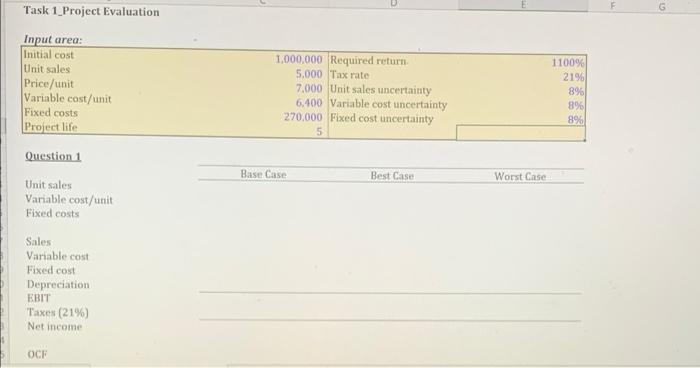
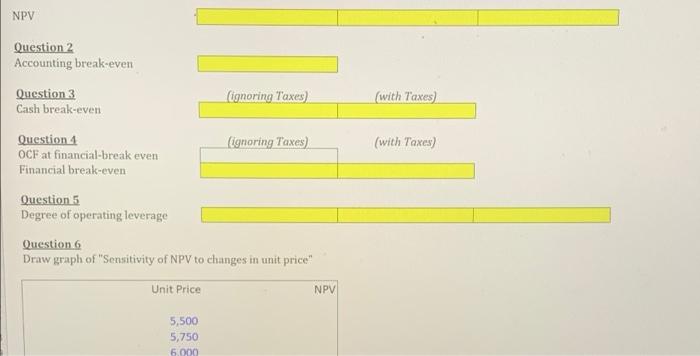
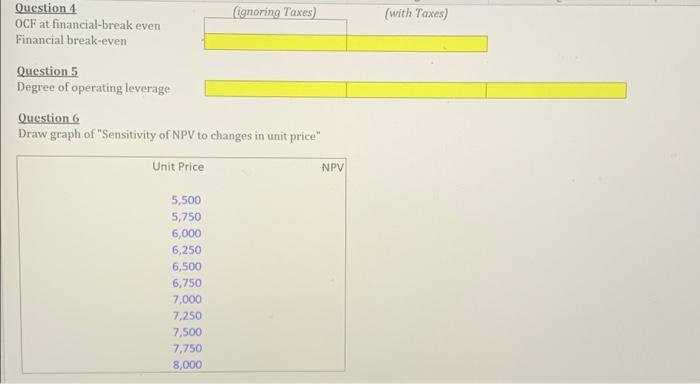
Task 1: Project Evaluation You are considering a new product launch. The project will cost $1,000,000, have a five-year life, and have no salvage value; depreciation is straight-line to zero. Sales are projected at 5,000 units per year, price per unit will be $7,000, variable cost per unit will be $6,400, and fixed costs will be $270,000 per year. The required return on the project is 11 percent, and the relevant tax rate is 21 percent. Based on your experience, you think the unit sales, variable cost, and fixed cost projections given here are probably accurate to within t 8 percent. Questions: 1. What are the upper and lower bounds for these projections? What are NPVs for the base- case, the best-case and worst-case scenarios? (15 Points) 2. What is the accounting break-even level of output for this project? Solve for both with taxes and ignoring taxes. (8 points) 3. What is the cash break-even level of output for this project? Solve for both with taxes and ignoring taxes. (8 Points) 4. What is the financial break-even level of output for this project? Solve for both with taxes and ignoring taxes. (8 Points) 5. What is the degree of operating leverage under each scenario? (6 Points) 6. Draw the chart showing the sensitivity of the base-case NPV to changes in unit price. (10 Points) Task 1_Project Evaluation G Input area: Initial cost Unit sales Price/unit Variable cost/unit Fixed costs Project life 1,000,000 Required return 5,000 Tax rate 7.000 Unit sales uncertainty 6,400 Variable cost uncertainty 270,000 Fixed cost uncertainty 5 1 100% 21% 896 8% 8% Base Case Best Case Worst Case Question 1 Unit sales Variable cost/unit Fixed costs Sales Variable cost Fixed cost Depreciation EBIT Taxes (21%) Net income OCE NPV Question 2 Accounting break-even Question 3 Cash break-even (ignoring Taxes) (with Taxes ignoring Taxes) (with Taxes) Question 1 OCF at financial break even Financial break-even Question 5 Degree of operating leverage Question 6 Draw graph of "Sensitivity of NPV to changes in unit price" Unit Price NPV 5,500 5,750 6.000 ignoring Taxes) (with Taxes) Question 4 OCF at financial-break even Financial break-even Question 5 Degree of operating leverage Question 6 Draw graph of "Sensitivity of NPV to changes in unit price" Unit Price NPV 5,500 5,750 6,000 6,250 6,500 6,750 7,000 7,250 7.500 7,750 8,000 Task 1: Project Evaluation You are considering a new product launch. The project will cost $1,000,000, have a five-year life, and have no salvage value; depreciation is straight-line to zero. Sales are projected at 5,000 units per year, price per unit will be $7,000, variable cost per unit will be $6,400, and fixed costs will be $270,000 per year. The required return on the project is 11 percent, and the relevant tax rate is 21 percent. Based on your experience, you think the unit sales, variable cost, and fixed cost projections given here are probably accurate to within t 8 percent. Questions: 1. What are the upper and lower bounds for these projections? What are NPVs for the base- case, the best-case and worst-case scenarios? (15 Points) 2. What is the accounting break-even level of output for this project? Solve for both with taxes and ignoring taxes. (8 points) 3. What is the cash break-even level of output for this project? Solve for both with taxes and ignoring taxes. (8 Points) 4. What is the financial break-even level of output for this project? Solve for both with taxes and ignoring taxes. (8 Points) 5. What is the degree of operating leverage under each scenario? (6 Points) 6. Draw the chart showing the sensitivity of the base-case NPV to changes in unit price. (10 Points) Task 1_Project Evaluation G Input area: Initial cost Unit sales Price/unit Variable cost/unit Fixed costs Project life 1,000,000 Required return 5,000 Tax rate 7.000 Unit sales uncertainty 6,400 Variable cost uncertainty 270,000 Fixed cost uncertainty 5 1 100% 21% 896 8% 8% Base Case Best Case Worst Case Question 1 Unit sales Variable cost/unit Fixed costs Sales Variable cost Fixed cost Depreciation EBIT Taxes (21%) Net income OCE NPV Question 2 Accounting break-even Question 3 Cash break-even (ignoring Taxes) (with Taxes ignoring Taxes) (with Taxes) Question 1 OCF at financial break even Financial break-even Question 5 Degree of operating leverage Question 6 Draw graph of "Sensitivity of NPV to changes in unit price" Unit Price NPV 5,500 5,750 6.000 ignoring Taxes) (with Taxes) Question 4 OCF at financial-break even Financial break-even Question 5 Degree of operating leverage Question 6 Draw graph of "Sensitivity of NPV to changes in unit price" Unit Price NPV 5,500 5,750 6,000 6,250 6,500 6,750 7,000 7,250 7.500 7,750 8,000
Step by Step Solution
There are 3 Steps involved in it

Get step-by-step solutions from verified subject matter experts