

Question: Task 1 Training Manager has provided you a range of resistors and advised you to produce a report of records of the values of
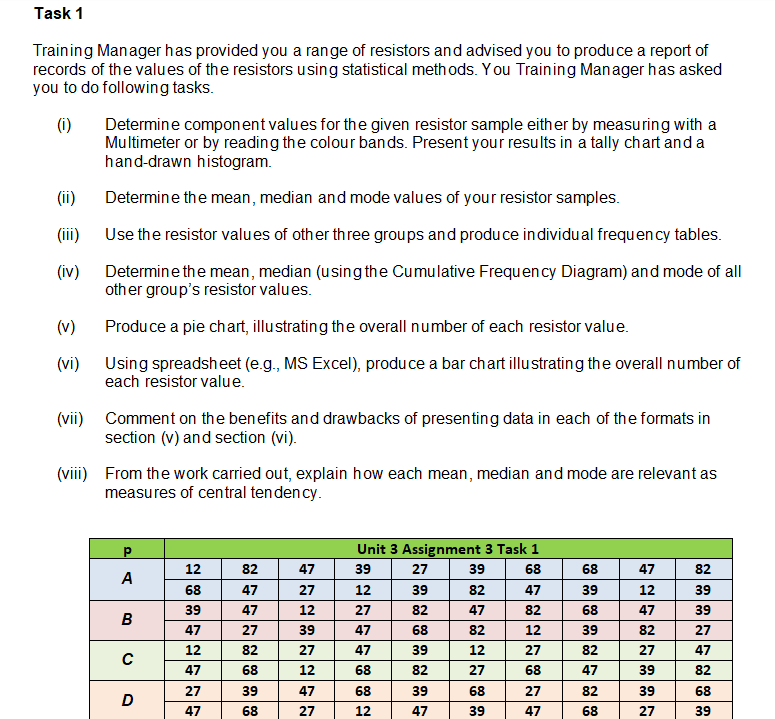
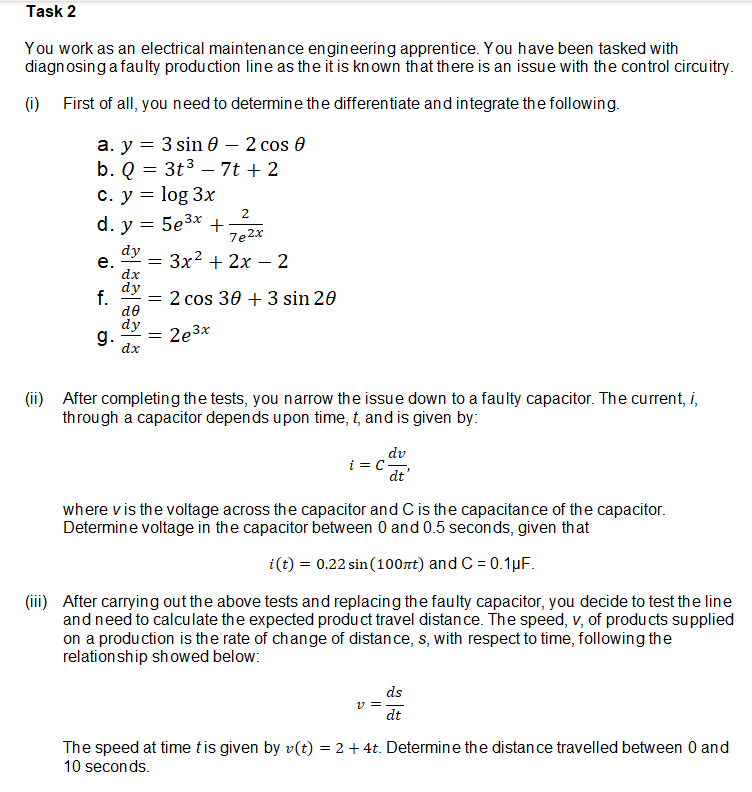
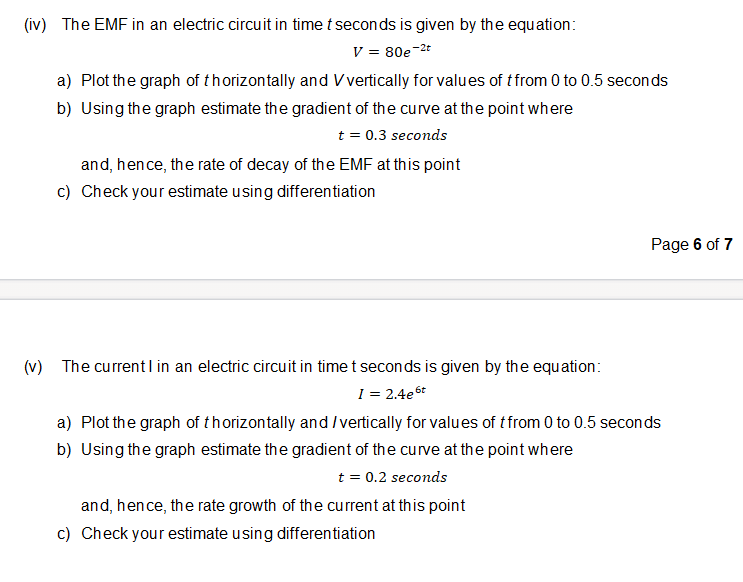
Task 1 Training Manager has provided you a range of resistors and advised you to produce a report of records of the values of the resistors using statistical methods. You Training Manager has asked you to do following tasks. (i) Determine component values for the given resistor sample either by measuring with a Multimeter or by reading the colour bands. Present your results in a tally chart and a hand-drawn histogram. (ii) Determine the mean, median and mode values of your resistor samples. (iii) (iv) (v) (vi) Use the resistor values of other three groups and produce individual frequency tables. Determine the mean, median (using the Cumulative Frequency Diagram) and mode of all other group's resistor values. Produce a pie chart, illustrating the overall number of each resistor value. Using spreadsheet (e.g., MS Excel), produce a bar chart illustrating the overall number of each resistor value. (vii) Comment on the benefits and drawbacks of presenting data in each of the formats in section (v) and section (vi). (viii) From the work carried out, explain how each mean, median and mode are relevant as measures of central tendency. P Unit 3 Assignment 3 Task 1 12 82 47 39 27 39 68 68 47 82 A 68 47 27 12 39 82 47 39 12 39 39 47 12 27 82 47 82 68 47 39 B 47 27 39 47 68 82 12 39 82 27 12 82 27 47 39 12 27 82 27 47 47 68 12 68 82 27 68 47 39 82 27 39 47 68 39 68 27 82 39 68 D 47 68 27 12 47 39 47 68 27 39 Task 2 You work as an electrical maintenance engineering apprentice. You have been tasked with diagnosing a faulty production line as the it is known that there is an issue with the control circuitry. (i) First of all, you need to determine the differentiate and integrate the following. a. y = 3 sin 0 - 2 cos 0 b. Q3t37t +2 c. y = log 3x 2 d. y = 5e3x + 7e2x dy e. = 3x+2x-2 dx dy f. = 2 cos 30 + 3 sin 20 de dy g. = dx 2e3x (ii) After completing the tests, you narrow the issue down to a faulty capacitor. The current, i, through a capacitor depends upon time, t, and is given by: dv i=c dt' where v is the voltage across the capacitor and C is the capacitance of the capacitor. Determine voltage in the capacitor between 0 and 0.5 seconds, given that i(t) = 0.22 sin (100t) and C = 0.1F. (iii) After carrying out the above tests and replacing the faulty capacitor, you decide to test the line and need to calculate the expected product travel distance. The speed, v, of products supplied on a production is the rate of change of distance, s, with respect to time, following the relationship showed below: ds v = dt The speed at time t is given by v(t) = 2 + 4t. Determine the distance travelled between 0 and 10 seconds. (iv) The EMF in an electric circuit in time t seconds is given by the equation: V = 80e-2+ a) Plot the graph of thorizontally and V vertically for values of t from 0 to 0.5 seconds b) Using the graph estimate the gradient of the curve at the point where t = 0.3 seconds and, hence, the rate of decay of the EMF at this point c) Check your estimate using differentiation Page 6 of 7 (v) The current I in an electric circuit in time t seconds is given by the equation: 1 = 2.4e6t a) Plot the graph of thorizontally and/vertically for values of t from 0 to 0.5 seconds b) Using the graph estimate the gradient of the curve at the point where t = 0.2 seconds and, hence, the rate growth of the current at this point c) Check your estimate using differentiation
Step by Step Solution
There are 3 Steps involved in it

Get step-by-step solutions from verified subject matter experts