

Question: Task 10 With reference to the R Square value provided in the Regression Statistics table, explain whether you would trust the estimated mean Advertised Price

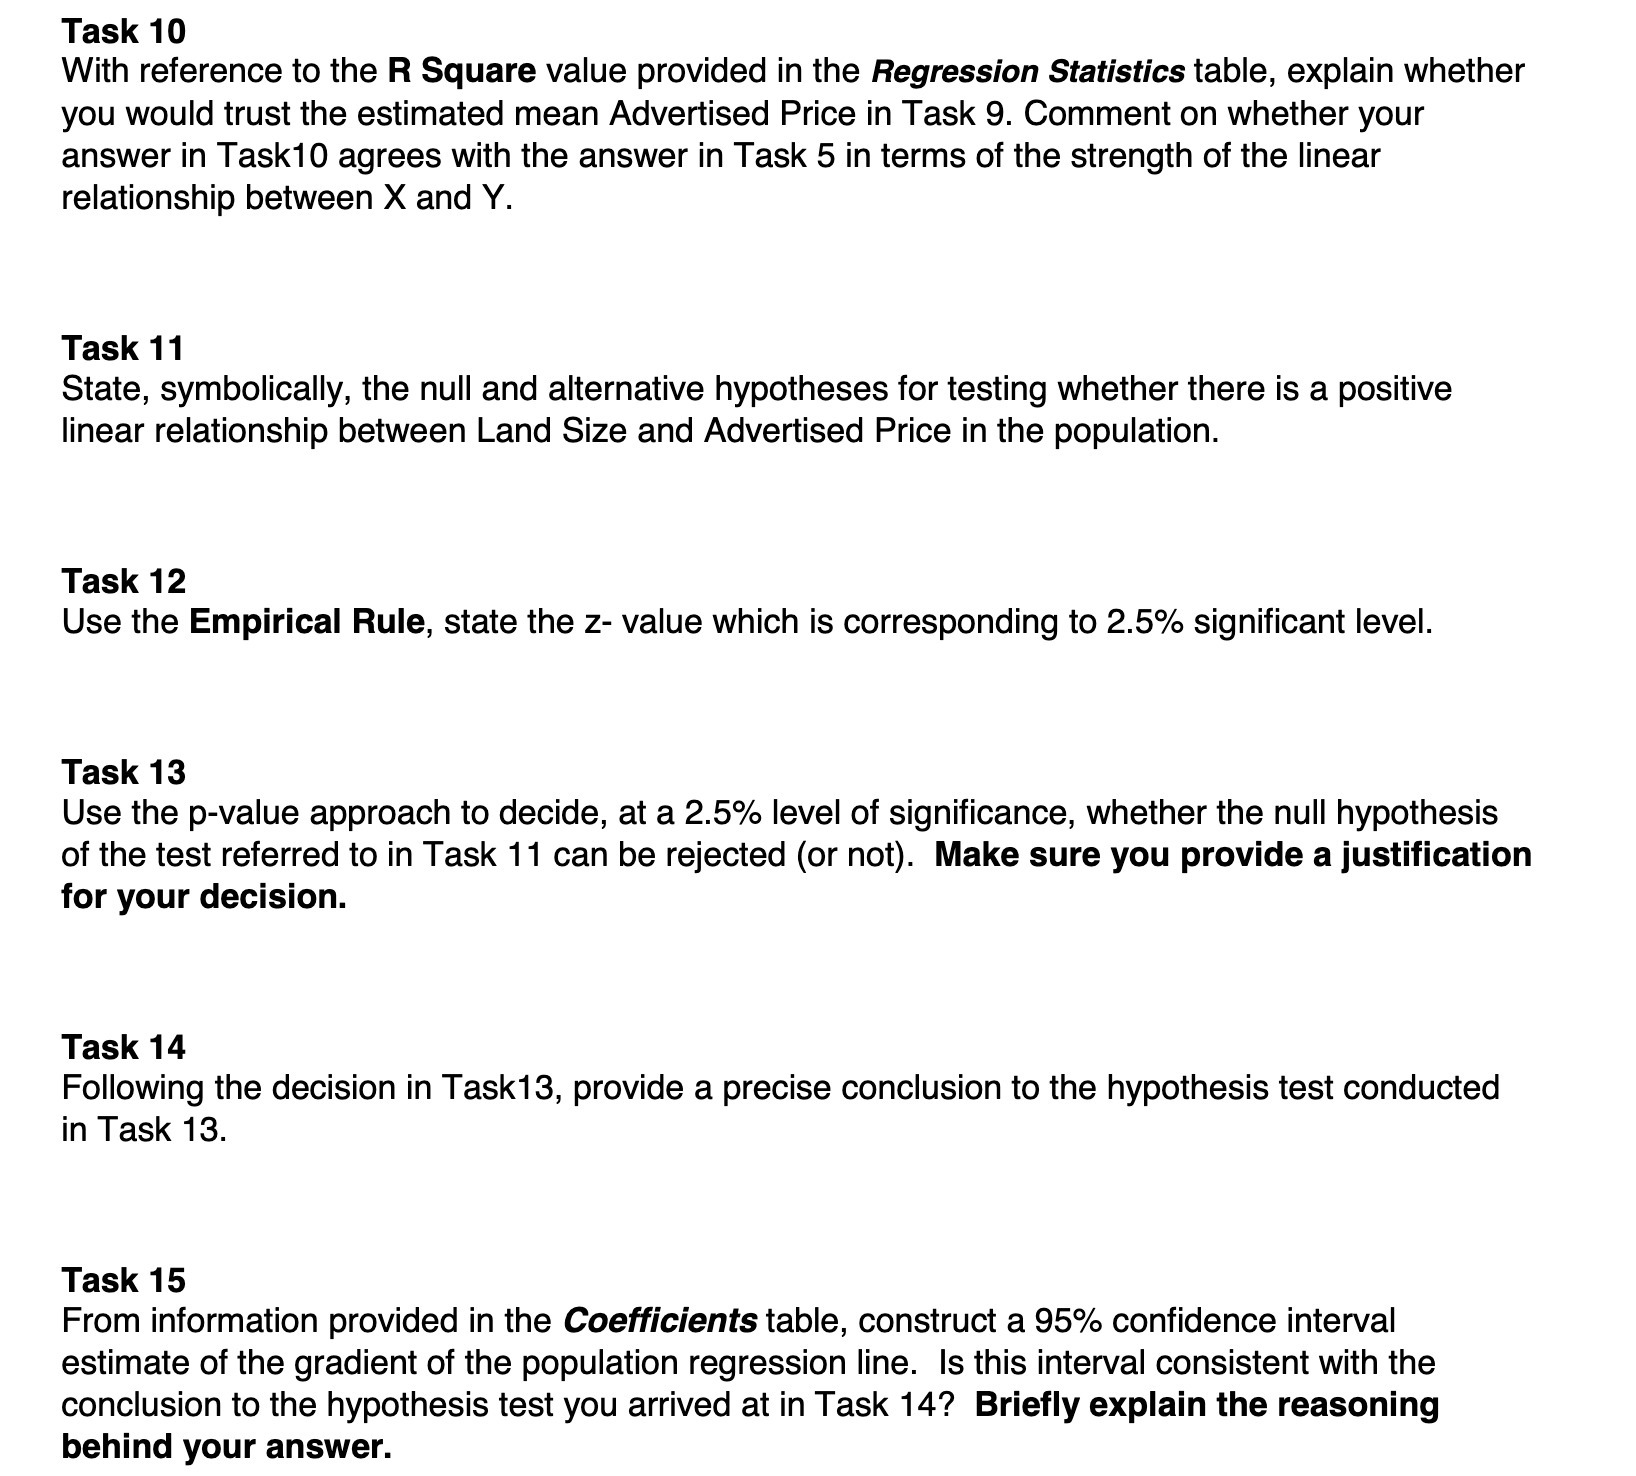
Task 10 With reference to the R Square value provided in the Regression Statistics table, explain whether you would trust the estimated mean Advertised Price in Task 9. Comment on whether your answer in Task10 agrees with the answer in Task 5 in terms of the strength of the linear relationship between X and Y. Task 11 State, symbolically, the null and alternative hypotheses for testing whether there is a positive linear relationship between Land Size and Advertised Price in the population. Task 12 Use the Empirical Rule, state the 2- value which is corresponding to 2.5% significant level. Task 13 Use the p-value approach to decide, at a 2.5% level of significance, whether the null hypothesis of the test referred to in Task 11 can be rejected (or not). Make sure you provide a justification for your decision. Task 14 Following the decision in Task13, provide a precise conclusion to the hypothesis test conducted in Task 13. Task 15 From information provided in the Coefficients table, construct a 95% confidence interval estimate of the gradient of the population regression line. Is this interval consistent with the conclusion to the hypothesis test you arrived at in Task 14? Briefly explain the reasoning behind your
Step by Step Solution
There are 3 Steps involved in it

Get step-by-step solutions from verified subject matter experts