

Question: Task 1b, Task1c and Task 1d In the table below (Table 1b-d) I have made one table you can use to put in all the
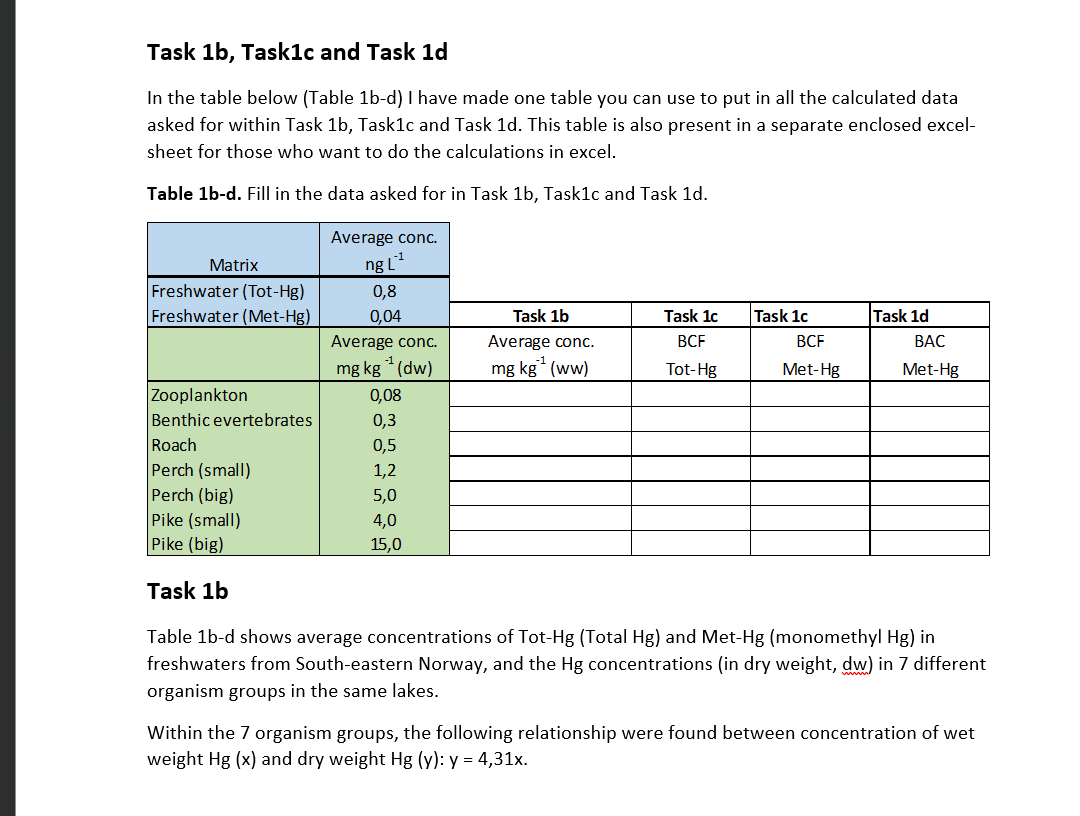
Task 1b, Task1c and Task 1d In the table below (Table 1b-d) I have made one table you can use to put in all the calculated data asked for within Task 1b, Task1c and Task 1d. This table is also present in a separate enclosed excelsheet for those who want to do the calculations in excel. Table 1b-d. Fill in the data asked for in Task 1b, Task1c and Task 1d. Task 1b Table 1b-d shows average concentrations of Tot- Hg (Total Hg ) and Met- Hg (monomethyl Hg ) in freshwaters from South-eastern Norway, and the Hg concentrations (in dry weight, dw ) in 7 different organism groups in the same lakes. Within the 7 organism groups, the following relationship were found between concentration of wet weight Hg(x) and dry weight Hg(y):y=4,31x
Step by Step Solution
There are 3 Steps involved in it

Get step-by-step solutions from verified subject matter experts