

Question: Task 2: A hypothesis test for a proportion We are foremost interested in whether individuals in the Pima tribe are more likely to test positive
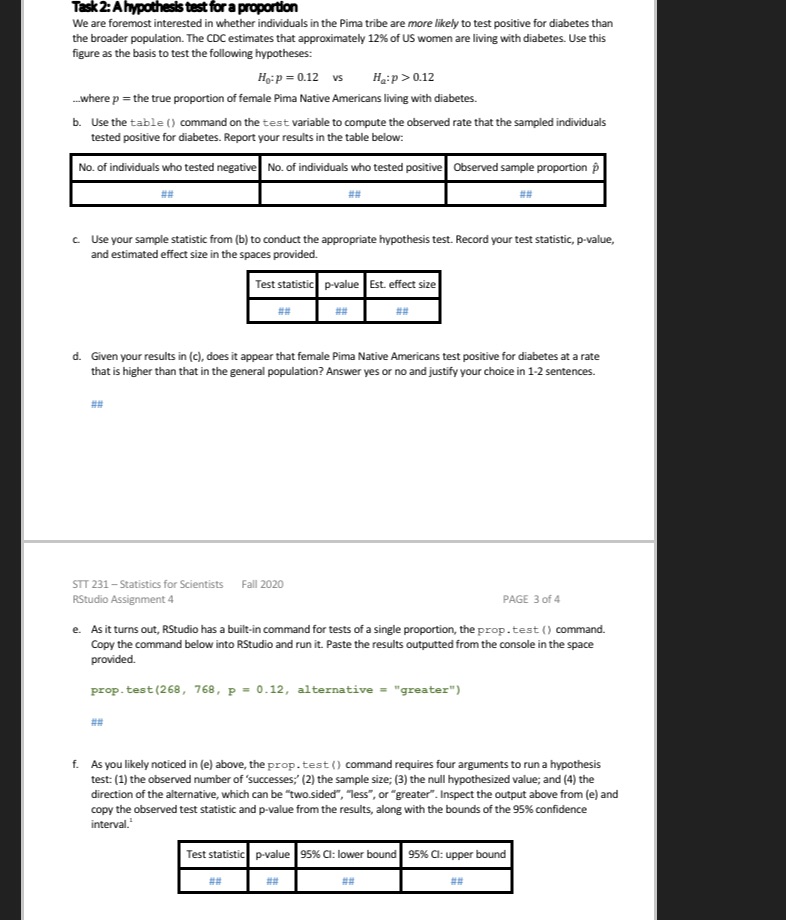
Task 2: A hypothesis test for a proportion We are foremost interested in whether individuals in the Pima tribe are more likely to test positive for diabetes than the broader population. The CDC estimates that approximately 12% of US women are living with diabetes. Use this figure as the basis to test the following hypotheses: Hop = 0.12 vs Ha:p >0.12 -.where p = the true proportion of female Pima Native Americans living with diabetes. b. Use the table () command on the test variable to compute the observed rate that the sampled individuals tested positive for diabetes. Report your results in the table below: No. of individuals who tested negative No. of individuals who tested positive Observed sample proportion p ## ## ## c. Use your sample statistic from (b) to conduct the appropriate hypothesis test. Record your test statistic, p-value, and estimated effect size in the spaces provided. Test statistic p-value Est. effect size ## ## ## d. Given your results in (c), does it appear that female Pima Native Americans test positive for diabetes at a rate that is higher than that in the general population? Answer yes or no and justify your choice in 1-2 sentences. STT 231 - Statistics for Scientists Fall 2020 RStudio Assignment 4 PAGE 3 of 4 e. As it turns out, RStudio has a built-in command for tests of a single proportion, the prop. test () command. Copy the command below into RStudio and run it. Paste the results outputted from the console in the space provided. prop. test (268, 768, p = 0.12, alternative = "greater") ## f. As you likely noticed in (e) above, the prop. test () command requires four arguments to run a hypothesis test: (1) the observed number of 'successes;" (2) the sample size; (3) the null hypothesized value; and (4) the direction of the alternative, which can be "two sided", "less", or "greater". Inspect the output above from (e) and copy the observed test statistic and p-value from the results, along with the bounds of the 95% confidence interval." Test statistic p-value 95% C: lower bound 95%% Cl: upper bound ##
Step by Step Solution
There are 3 Steps involved in it

Get step-by-step solutions from verified subject matter experts