

Question: Task 2: Applications (25 marks) Show all work for each question. 7. The average annual exchange rate in Canada for the US dollar from 2008-2018
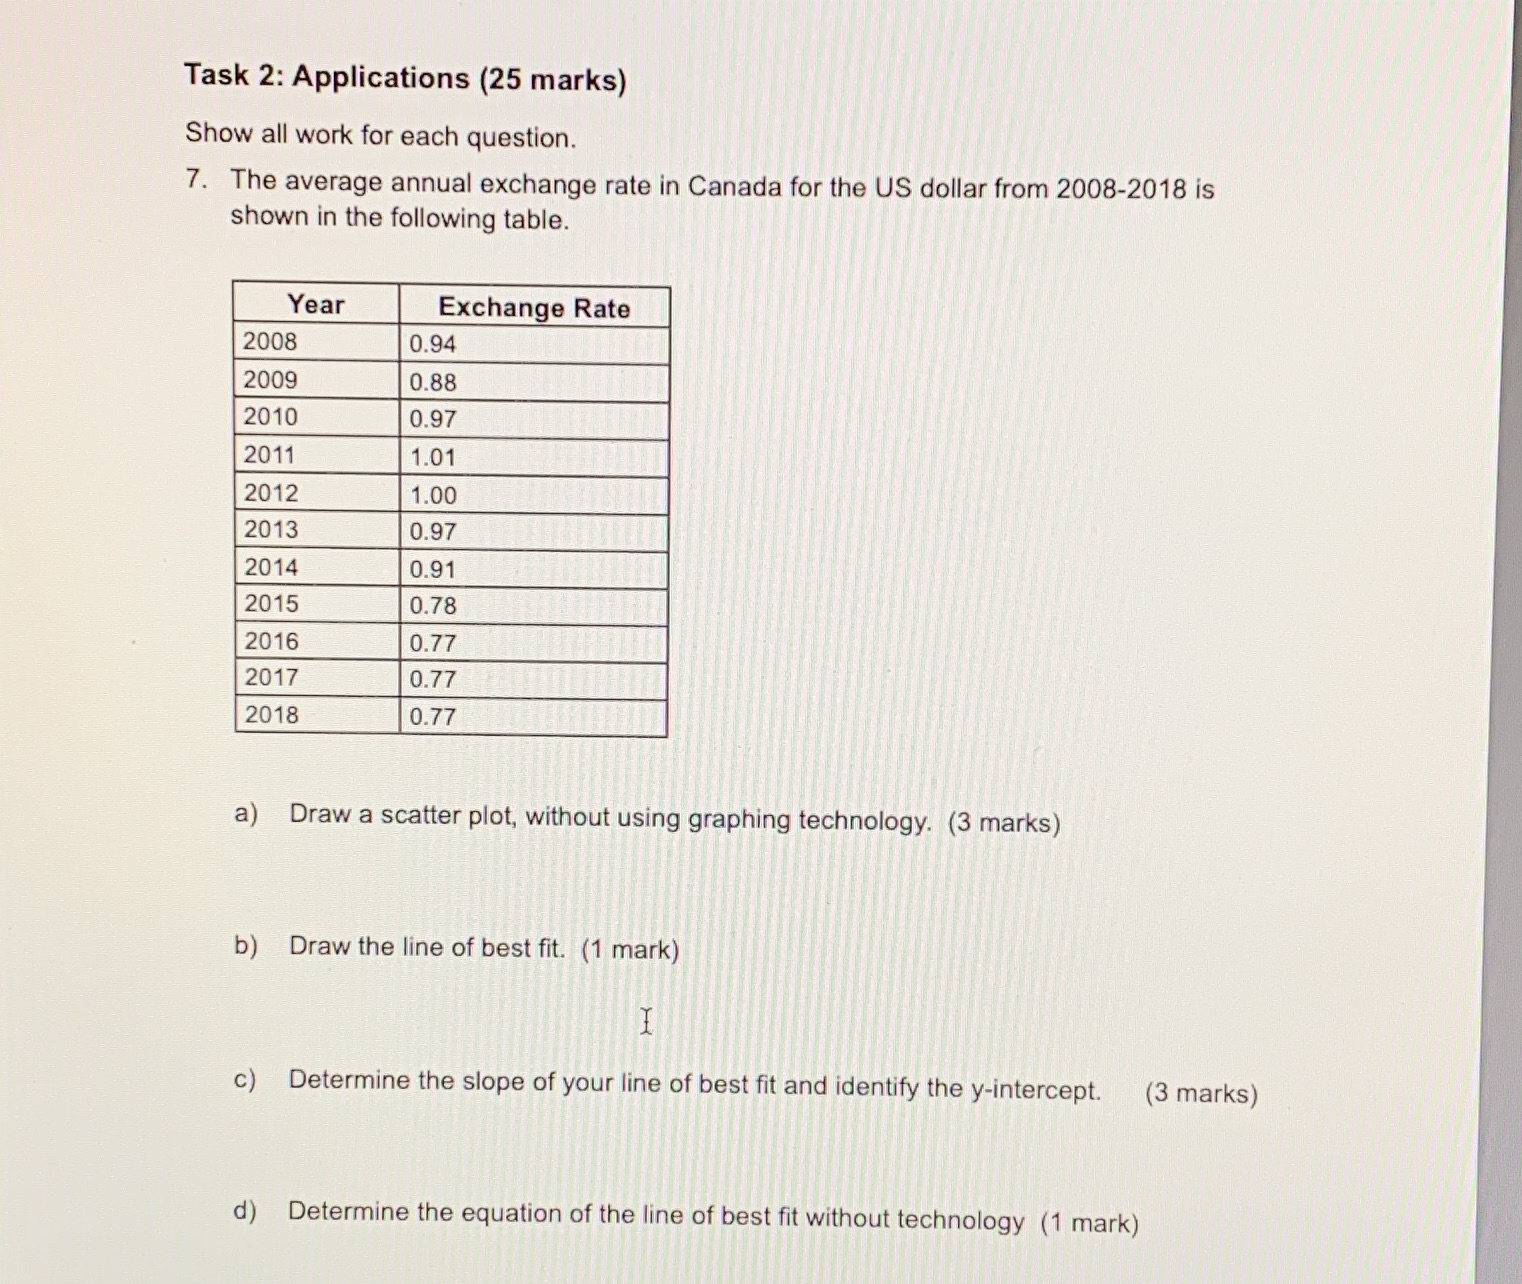
Task 2: Applications (25 marks) Show all work for each question. 7. The average annual exchange rate in Canada for the US dollar from 2008-2018 is shown in the following table. Year Exchange Rate 2008 0.94 2009 0.88 2010 0.97 2011 1.01 2012 1.00 2013 0.97 2014 0.91 2015 0.78 2016 0.77 2017 0.77 2018 0.77 a) Draw a scatter plot, without using graphing technology. (3 marks) b) Draw the line of best fit. (1 mark) I c) Determine the slope of your line of best fit and identify the y-intercept. (3 marks) d) Determine the equation of the line of best fit without technology (1 mark)
Step by Step Solution
There are 3 Steps involved in it
1 Expert Approved Answer
Step: 1 Unlock

Question Has Been Solved by an Expert!
Get step-by-step solutions from verified subject matter experts
Step: 2 Unlock
Step: 3 Unlock