

Question: TASK 2 : Create a text - based plot of the candlestick data The second task involves creating a text - based plot of the
TASK : Create a textbased plot of the candlestick data
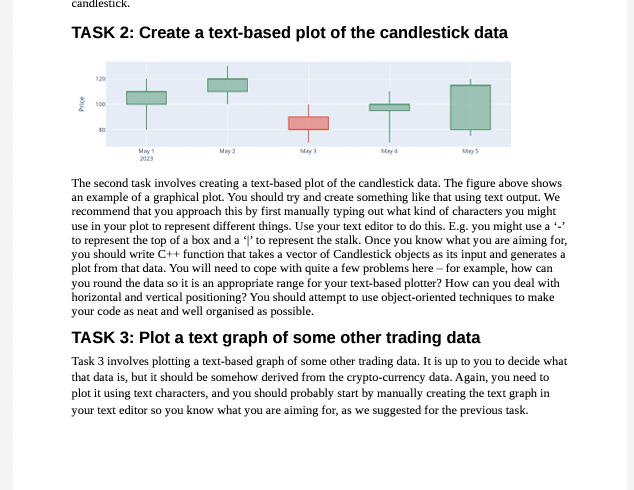
The second task involves creating a textbased plot of the candlestick data. The figure above shows
an example of a graphical plot. You should try and create something like that using text output. We
recommend that you approach this by first manually typing out what kind of characters you might
use in your plot to represent different things. Use your text editor to do this. Eg you might use a
to represent the top of a box and a to represent the stalk. Once you know what you are aiming for,
you should write function that takes a vector of Candlestick objects as its input and generates a
plot from that data. You will need to cope with quite a few problems here for example, how can
you round the data so it is an appropriate range for your textbased plotter? How can you deal with
horizontal and vertical positioning? You should attempt to use objectoriented techniques to make
your code as neat and well organised as possible.
TASK : Plot a text graph of some other trading data
Task involves plotting a textbased graph of some other trading data. It is up to you to decide what
that data is but it should be somehow derived from the cryptocurrency data. Again, you need to
plot it using text characters, and you should probably start by manually creating the text graph in
your text editor so you know what you are aiming for, as we suggested for the previous task.
Step by Step Solution
There are 3 Steps involved in it
1 Expert Approved Answer
Step: 1 Unlock

Question Has Been Solved by an Expert!
Get step-by-step solutions from verified subject matter experts
Step: 2 Unlock
Step: 3 Unlock