

Question: Task 2: Customer-Level Analysis Using the clean dataset generated in the last step of Task 1, calculate the following metrics for each individual customer, then
Task 2: Customer-Level Analysis Using the clean dataset generated in the last step of Task 1, calculate the following metrics for each individual customer, then report the average across all customers. Do not round when calculating metrics for each individual customer, but rather round your final answer after averaging across customers.
1. Average Purchase Amount (APA) = Total revenue from the customer within a given time period / number of purchase transactions made by the customer in the same time period [Use the last three fiscal years in the dataset as the time period. After averaging across customers, round final answer to the nearest whole dollar.]
2. Annual Purchase Frequency (APF) = Number of times the customer makes a purchase each year [Use the average number of purchases made annually by each customer over the last three fiscal years in the dataset. After averaging across customers, round final answer to two decimal places.]
3. Customer Lifetime Revenue (CLR) = Average Purchase Amount * Annual Purchase Frequency * Customer Longevity (number of years the customer is expected to actively contribute to revenueassume that historical data shows this to be 9 years on average and use this assumption for all customers) [Use the raw (not rounded) values calculated in the earlier two steps as inputs into this calculation. After averaging across customers, round final answer to the nearest whole dollar.]
4. Share of Wallet (SOW) = Spend with this retailer / total spend in category [For both inputs, use self-reported survey data of customers who made a purchase within the last three fiscal years in the dataset. Make SOW a missing value if total spend in the category for the customer is $0. After averaging across customers, round percentage to two decimal places in your final answer (x.xx%); use Excel to adjust decimal places and type whatever appears in the cell when two decimals are displayed]
HINT: if youve completed this task properly, you should have calculated customer-level metrics for 1,050 customers and then averaged across these customers to report your final answer for each metric.
(Can't upload entire file. This is a small portion. Just can't figure out best way to address the questions.)
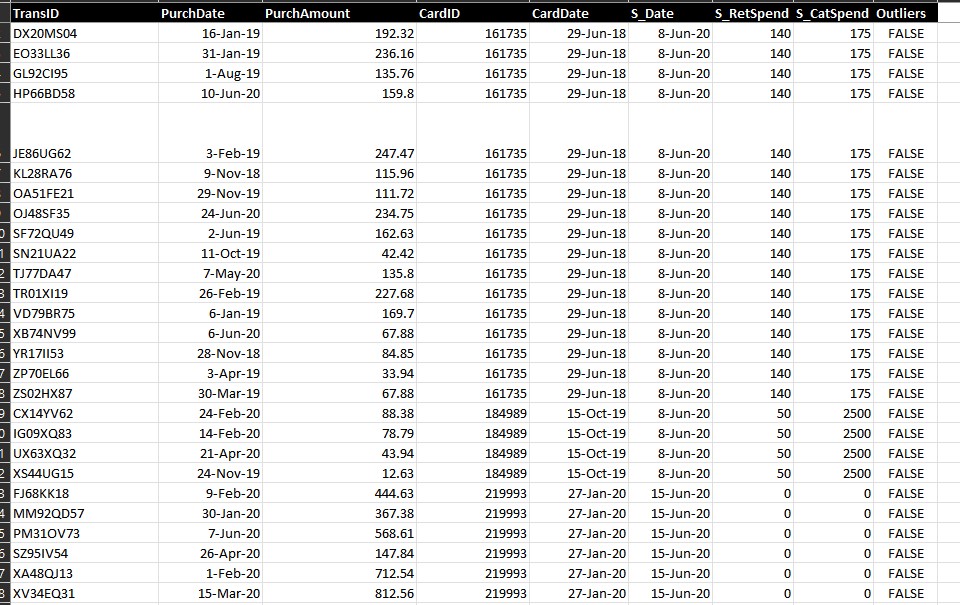
\begin{tabular}{|c|c|c|c|c|c|c|c|c|} \hline TransID & PurchDate & PurchAmount & CardID & CardDate & S_Date & S_RetSpend & S_CatSpend & Outliers \\ \hline DX20MS04 & 16-Jan-19 & 192.32 & 161735 & 29-Jun-18 & 8-Jun-20 & 140 & 175 & FALSE \\ \hline EO33LL36 & 31-Jan-19 & 236.16 & 161735 & 29-Jun-18 & 8-Jun-20 & 140 & 175 & FALSE \\ \hline GL92CI95 & 1-Aug-19 & 135.76 & 161735 & 29-Jun-18 & 8-Jun-20 & 140 & 175 & FALSE \\ \hline HP66BD58 & 10 -Jun-20 & 159.8 & 161735 & 29-Jun-18 & 8-Jun-20 & 140 & 175 & FALSE \\ \hline JE86UG62 & 3-Feb-19 & 247.47 & 161735 & 29-Jun-18 & 8-Jun-20 & 140 & 175 & FALSE \\ \hline KL28RA76 & 9-Nov-18 & 115.96 & 161735 & 29-Jun-18 & 8-Jun-20 & 140 & 175 & FALSE \\ \hline OA51FE21 & 29-Nov-19 & 111.72 & 161735 & 29-Jun-18 & 8-Jun-20 & 140 & 175 & FALSE \\ \hline OJ48SF35 & 24-Jun-20 & 234.75 & 161735 & 29-Jun-18 & 8-Jun-20 & 140 & 175 & FALSE \\ \hline SF72QU49 & 2-Jun-19 & 162.63 & 161735 & 29-Jun-18 & 8-Jun-20 & 140 & 175 & FALSE \\ \hline SN21UA22 & 11-Oct-19 & 42.42 & 161735 & 29-Jun-18 & 8-Jun-20 & 140 & 175 & FALSE \\ \hline TJ77DA47 & 7-May-20 & 135.8 & 161735 & 29-Jun-18 & 8-Jun-20 & 140 & 175 & FALSE \\ \hline TR01XI19 & 26-Feb-19 & 227.68 & 161735 & 29-Jun-18 & 8-Jun-20 & 140 & 175 & FALSE \\ \hline XB74NV99 & 6-Jun-20 & 67.88 & 161735 & 29-Jun-18 & 8-Jun-20 & 140 & 175 & FALSE \\ \hline YR17II53 & 28-Nov-18 & 84.85 & 161735 & 29-Jun-18 & 8-Jun-20 & 140 & 175 & FALSE \\ \hline ZP70EL66 & 3-Apr-19 & 33.94 & 161735 & 29-Jun-18 & 8-Jun-20 & 140 & 175 & FALSE \\ \hline ZS02HX87 & 30-Mar-19 & 67.88 & 161735 & 29-Jun-18 & 8-Jun-20 & 140 & 175 & FALSE \\ \hline CX14YV62 & 24Feb20 & 88.38 & 184989 & 15-Oct-19 & 8-Jun-20 & 50 & 2500 & FALSE \\ \hline IG09XQ83 & 14Feb20 & 78.79 & 184989 & 15-Oct-19 & 8-Jun-20 & 50 & 2500 & FALSE \\ \hline UX63XQ32 & 21-Apr-20 & 43.94 & 184989 & 15-Oct-19 & 8-Jun-20 & 50 & 2500 & FALSE \\ \hline XS44UG15 & 24-Nov-19 & 12.63 & 184989 & 15 -Oct-19 & 8-Jun-20 & 50 & 2500 & FALSE \\ \hline FJ68KK18 & 9-Feb-20 & 444.63 & 219993 & 27-Jan-20 & 15 -Jun-20 & 0 & 0 & FALSE \\ \hline MM92QD57 & 30Jan20 & 367.38 & 219993 & 27-Jan-20 & 15Jun20 & 0 & 0 & FALSE \\ \hline PM310V73 & 7-Jun-20 & 568.61 & 219993 & 27-Jan-20 & 15 -Jun-20 & 0 & 0 & FALSE \\ \hline SZ95IV54 & 26-Apr-20 & 147.84 & 219993 & 27-Jan-20 & 15 -Jun-20 & 0 & 0 & FALSE \\ \hline XA48Q13 & 1-Feb-20 & 712.54 & 219993 & 27-Jan-20 & 15 -Jun-20 & 0 & 0 & FALSE \\ \hline XV34EQ31 & 15-Mar-20 & 812.56 & 219993 & 27-Jan-20 & 15 -Jun-20 & 0 & 0 & FALSE \\ \hline \end{tabular}
Step by Step Solution
There are 3 Steps involved in it

Get step-by-step solutions from verified subject matter experts