

Question: TASK 2 - Data Visualisation This dataset should be used for TASK 2: MutzNutzCWTask2DataVisualisation This dataset is different to the one used in TASK 1.
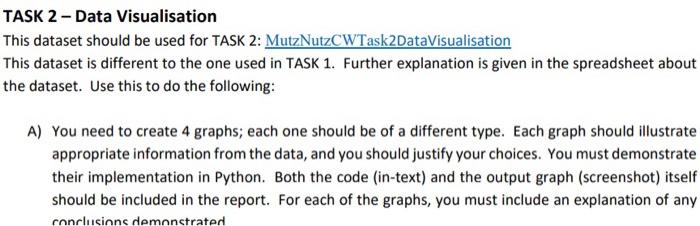
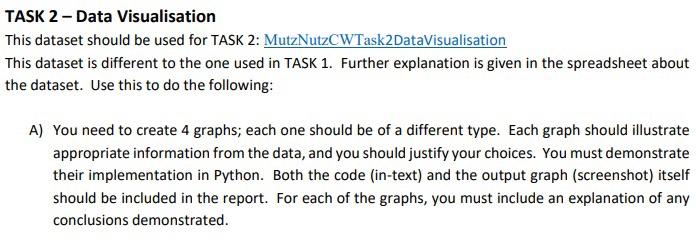
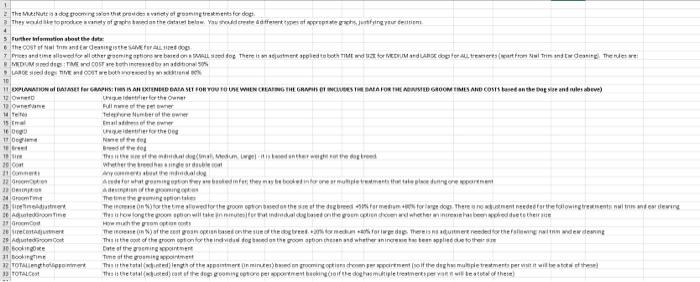
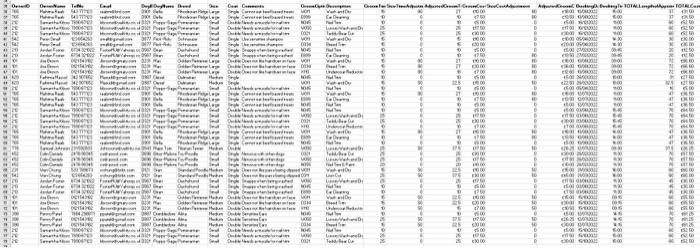
TASK 2 - Data Visualisation This dataset should be used for TASK 2: MutzNutzCWTask2DataVisualisation This dataset is different to the one used in TASK 1. Further explanation is given in the spreadsheet about the dataset. Use this to do the following: A) You need to create 4 graphs; each one should be of a different type. Each graph should illustrate appropriate information from the data, and you should justify your choices. You must demonstrate their implementation in Python. Both the code (in-text) and the output graph (screenshot) itself should be included in the report. For each of the graphs, you must include an explanation of any Proingie beif bot id the cancet fichich a. hoib of in ieires Wiopelgurefer to te fog Cete if the goxing Moplowiter TASK 2 - Data Visualisation This dataset should be used for TASK 2: MutzNutzCWTask2DataVisualisation This dataset is different to the one used in TASK 1. Further explanation is given in the spreadsheet about the dataset. Use this to do the following: A) You need to create 4 graphs; each one should be of a different type. Each graph should illustrate appropriate information from the data, and you should justify your choices. You must demonstrate their implementation in Python. Both the code (in-text) and the output graph (screenshot) itself should be included in the report. For each of the graphs, you must include an explanation of any conclusions demonstrated. Funter informition stont the dra
Step by Step Solution
There are 3 Steps involved in it

Get step-by-step solutions from verified subject matter experts