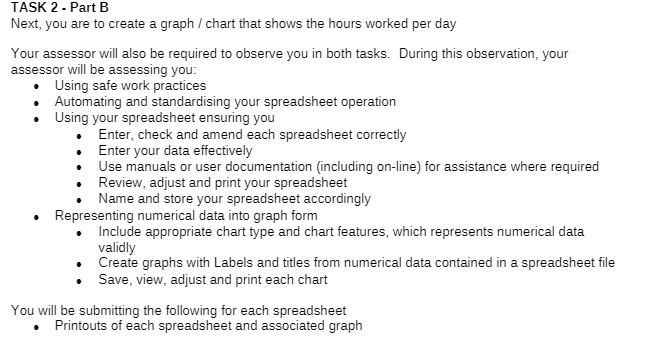
Question: TASK 2 - Part B Next, you are to create a graph / chart that shows the hours worked per day Your assessor will also

TASK 2 - Part B Next, you are to create a graph /
TASK 2 - Part B Next, you are to create a graph / chart that shows the hours worked per day Your assessor will also be required to observe you in both tasks. During this observation, your assessor will be assessing you: Using safe work practices Automating and standardising your spreadsheet operation Using your spreadsheet ensuring you Enter, check and amend each spreadsheet correctly Enter your data effectively Use manuals or user documentation (including on-line) for assistance where required Review, adjust and print your spreadsheet Name and store your spreadsheet accordingly Representing numerical data into graph form Include appropriate chart type and chart features, which represents numerical data validly Create graphs with Labels and titles from numerical data contained in a spreadsheet file Save, view, adjust and print each chart You will be submitting the following for each spreadsheet Printouts of each spreadsheet and associated graph

Step by Step Solution

There are 3 Steps involved in it

1 Expert Approved Answer
Step: 1 Unlock blur-text-image
Question Has Been Solved by an Expert!

Get step-by-step solutions from verified subject matter experts

Step: 2 Unlock
Step: 3 Unlock

Students Have Also Explored These Related Accounting Questions!