

Question: Task 2 The table gives the demand and supply schedules of teenage labour. Draw the demand and supply curves. Calculate the equilibrium wage rate, the
Task 2
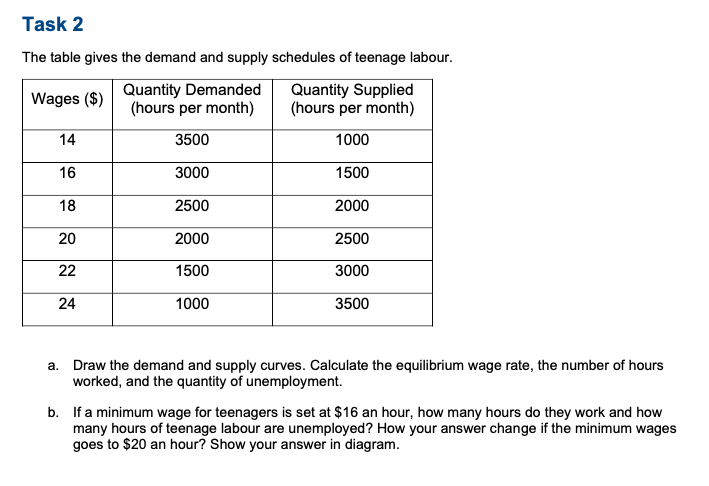
The table gives the demand and supply schedules of teenage labour.
- Draw the demand and supply curves. Calculate the equilibrium wage rate, the number of hours worked, and the quantity of unemployment.
- If a minimum wage for teenagers is set at $16 an hour, how many hours do they work and how many hours of teenage labour are unemployed? How your answer change if the minimum wages goes to $20 an hour? Show your answer in diagram.
Task 2 The table gives the demand and supply schedules of teenage labour. Quantity Demanded Quantity Supplied Wages [9 {hours per month} {hours per month) \" \"\" -\"u a. Draw the demand and supply curves. Calculate the equilibrium wage rate. the number of hours worked, and the quantity of unemployment. b. If a minimum wage forteenagers is set at $15 an hour, hoylI many hours do they work and how many hours of teenage labour are unemployed? How your answer change if the minimum wages goes to u an hour'? Show your answer in diagram
Step by Step Solution
There are 3 Steps involved in it
1 Expert Approved Answer
Step: 1 Unlock

Question Has Been Solved by an Expert!
Get step-by-step solutions from verified subject matter experts
Step: 2 Unlock
Step: 3 Unlock