

Question: Task 2 : Using what you have learnt from lesson, find out if there are any missing data in the dataFrame. Show in your Jupyter
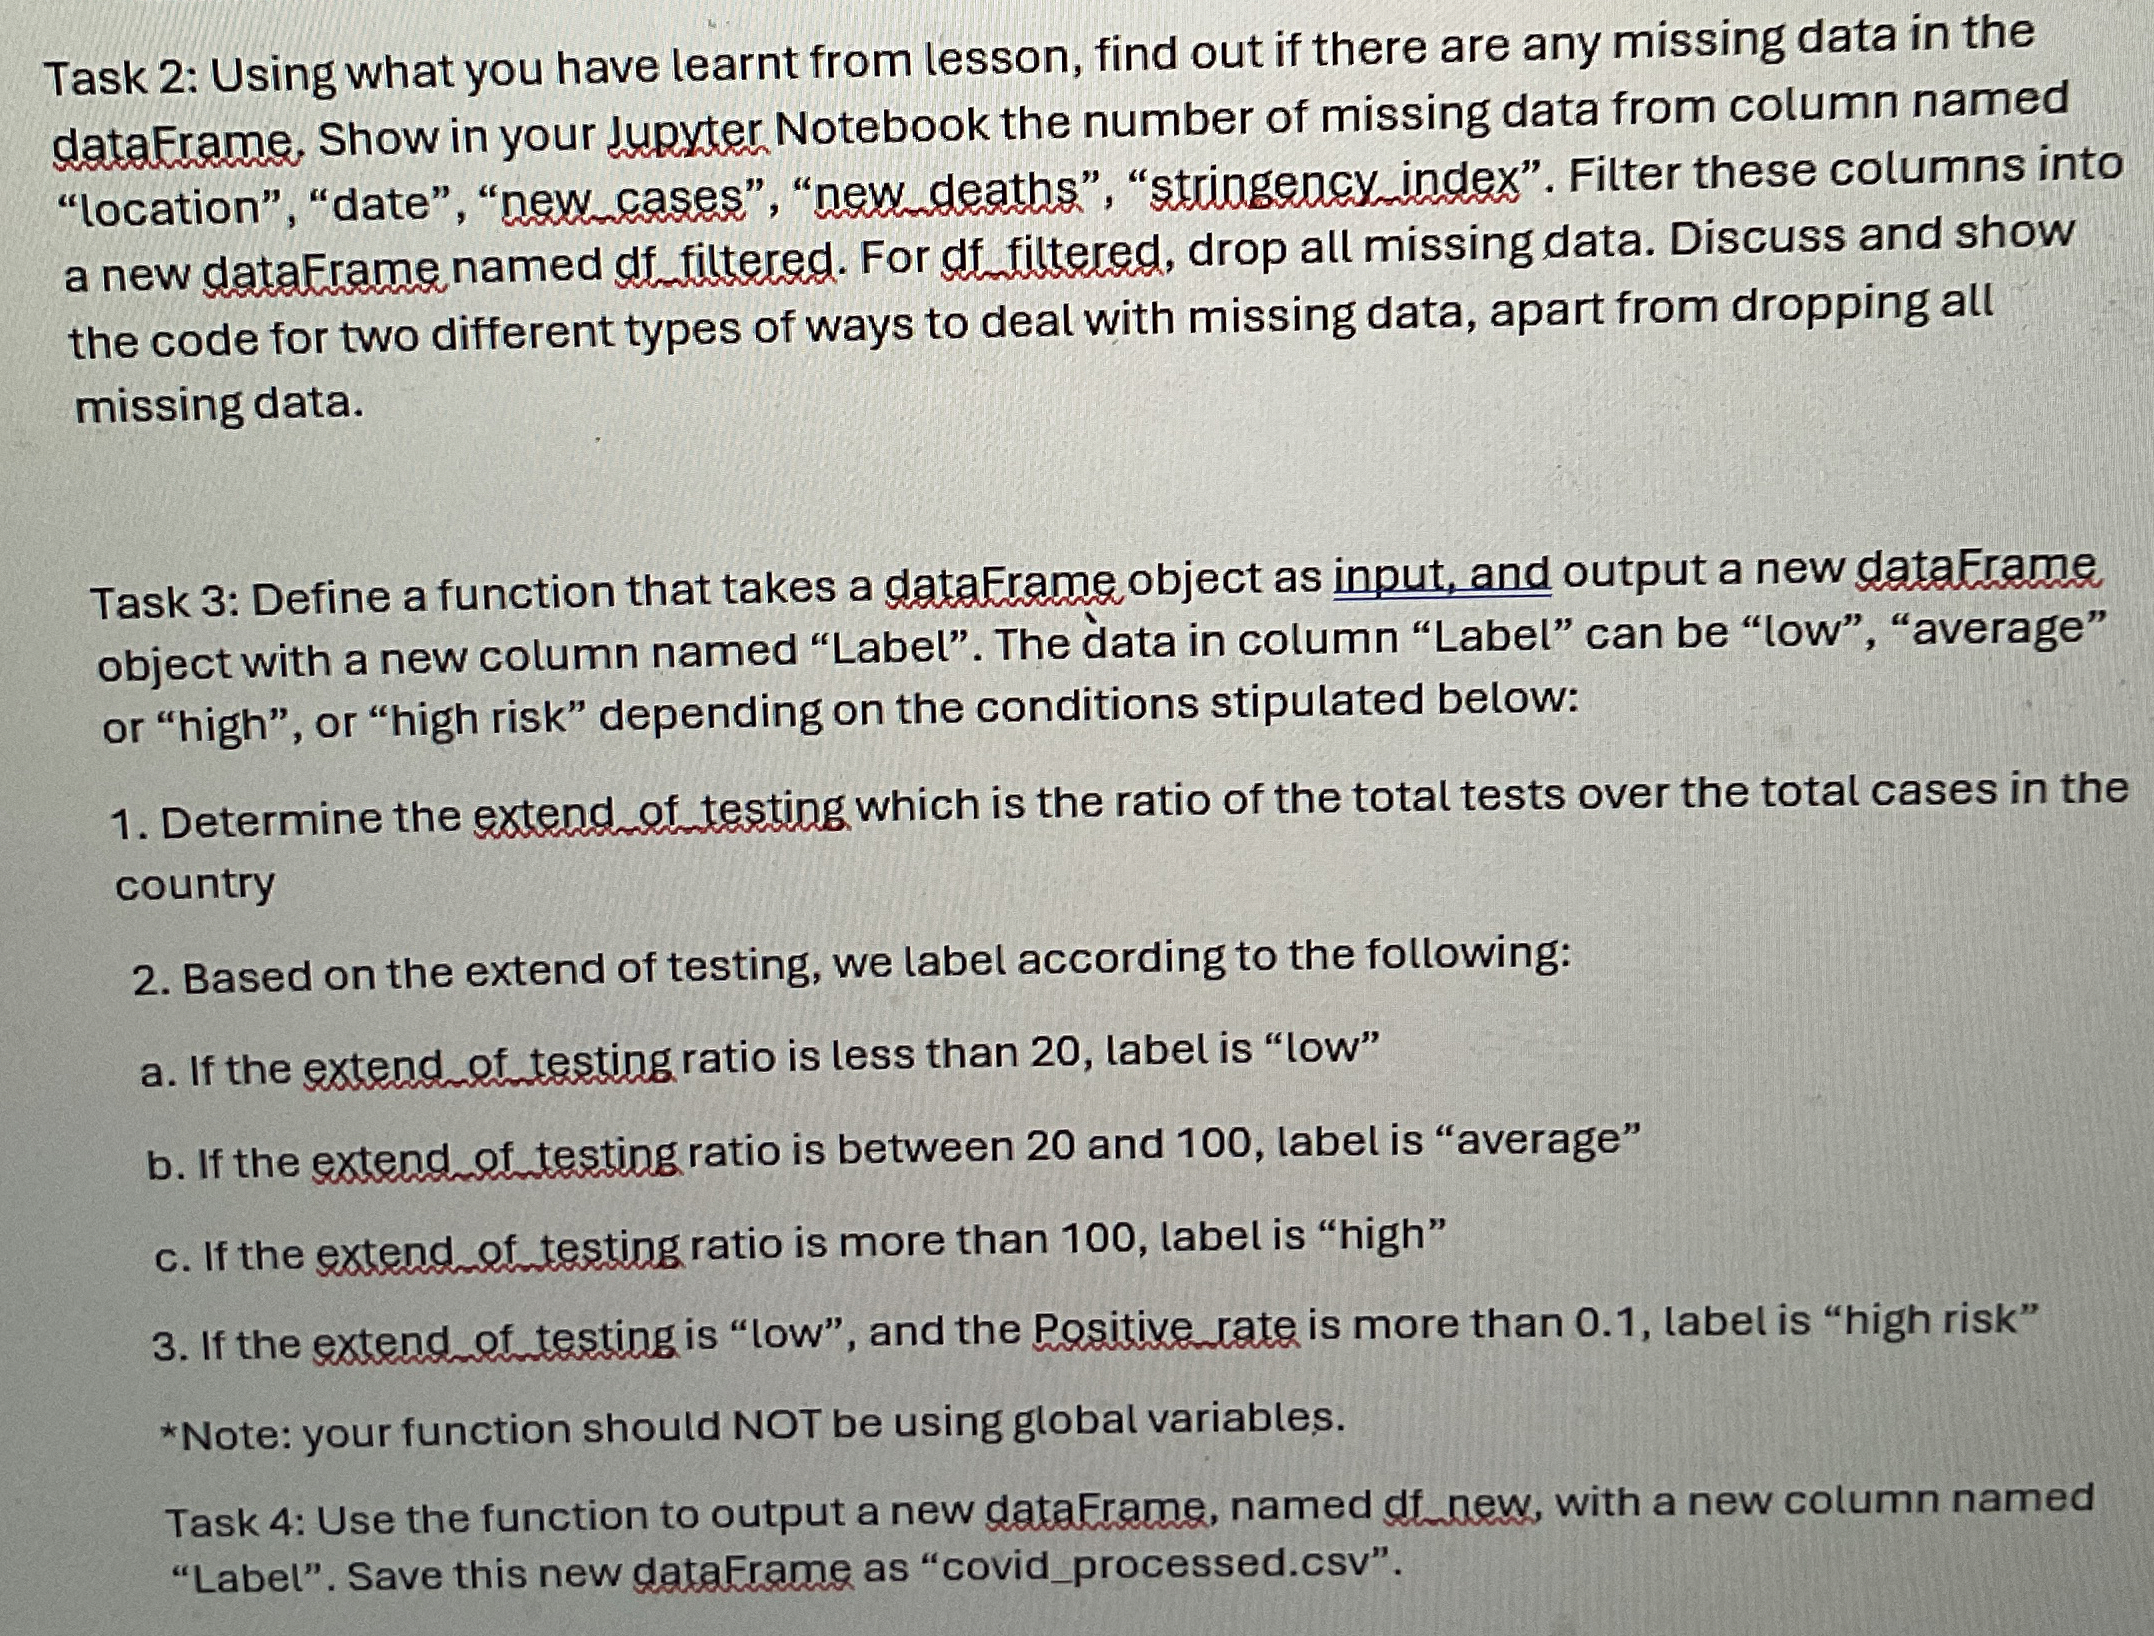
Task : Using what you have learnt from lesson, find out if there are any missing data in the dataFrame. Show in your Jupyter Notebook the number of missing data from column named "location", "date", "new cases", "new deaths", "stringency index". Filter these columns into a new dataErame named df filtered. For df filtered, drop all missing data. Discuss and show the code for two different types of ways to deal with missing data, apart from dropping all missing data.
Task : Define a function that takes a dataErame object as input, and output a new dataErame object with a new column named "Label". The data in column "Label" can be "low", "average" or "high", or "high risk" depending on the conditions stipulated below:
Determine the extend of testing which is the ratio of the total tests over the total cases in the country
Based on the extend of testing, we label according to the following:
a If the extend of testing ratio is less than label is "low"
b If the extend of testing ratio is between and label is "average"
c If the extend of testing ratio is more than label is "high"
If the extend of testing is "low", and the Positive rate is more than label is "high risk"
Note: your function should NOT be using global variables.
Task : Use the function to output a new dataErame, named df new, with a new column named "Label". Save this new dataFrame as "covidprocessed.csv
Step by Step Solution
There are 3 Steps involved in it
1 Expert Approved Answer
Step: 1 Unlock

Question Has Been Solved by an Expert!
Get step-by-step solutions from verified subject matter experts
Step: 2 Unlock
Step: 3 Unlock