

Question: Task 3 : Accident frequency 3 The table below shows Contritum's accident history over the past 3 years. table [ [ Year , 2
Task : Accident frequency
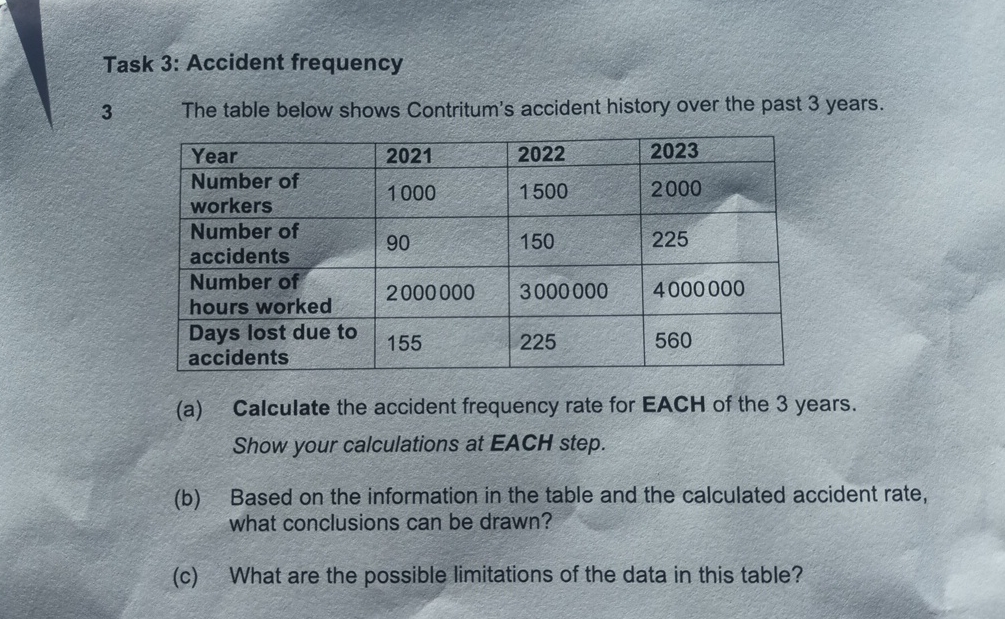
The table below shows Contritum's accident history over the past years.
tableYeartableNumber ofworkerstableNumber ofaccidentstableNumber ofhours workedtableDays lost due toaccidents
a Calculate the accident frequency rate for EACH of the years.
Show your calculations at EACH step.
b Based on the information in the table and the calculated accident rate, what conclusions can be drawn?
c What are the possible limitations of the data in this table?
Step by Step Solution
There are 3 Steps involved in it
1 Expert Approved Answer
Step: 1 Unlock

Question Has Been Solved by an Expert!
Get step-by-step solutions from verified subject matter experts
Step: 2 Unlock
Step: 3 Unlock