

Question: Task 3: Line codes and their spectrum Binary Source bits can be modulated by line codes to be transmitted through a baseband channel. There are
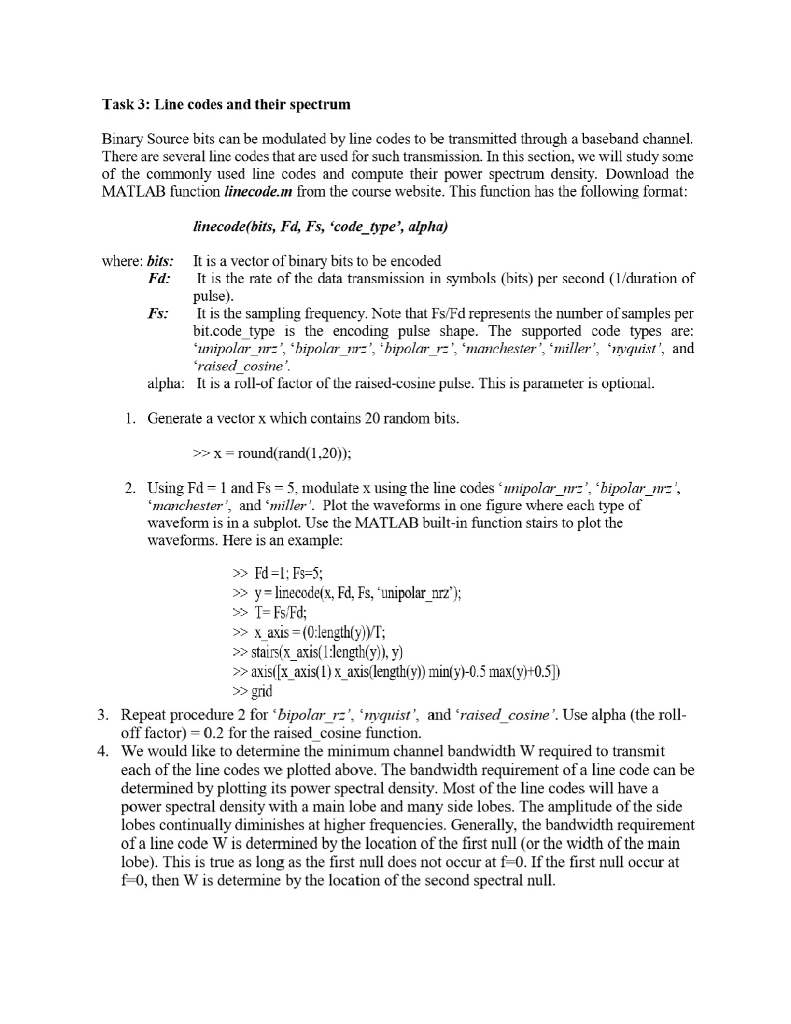
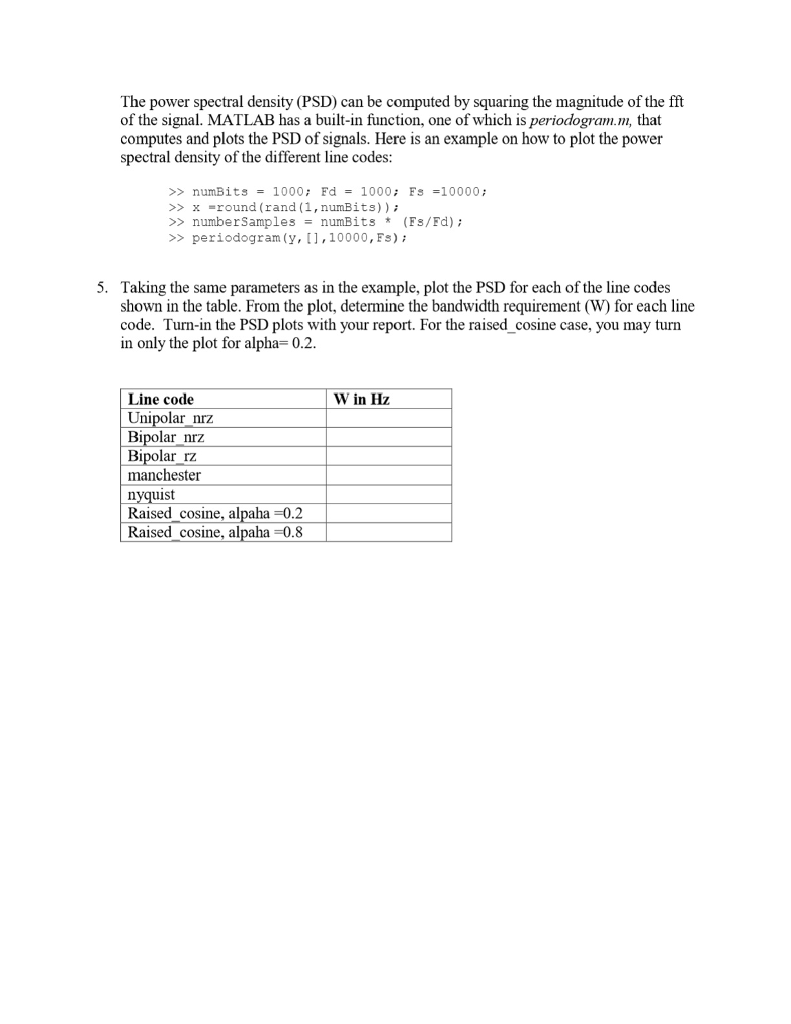
Task 3: Line codes and their spectrum Binary Source bits can be modulated by line codes to be transmitted through a baseband channel. There are several line codes that are used for such transmission. In this section, we will study some of the commonly used line codes and compute their power spectrum density. Download the MATLAB function linecode.m from the course website. This function has the following format linecode(bits, Fd, Fs, 'code type', alpha) It is a vector of binary bits to be encoded pulse) bit.code type is the encoding pulse shape. The supported code types are where: bits: Fd: t is the rate of the data transmission in symbols (bits) per second (1/duration of F It is the sampling frequency. Note that Fs/Fd represents the number ofsamples per nipolar m-, 'hipolar nr-', 'hipolar rz', 'manchester, 'miller' 'vquist', and raised cosine. alpha: It is a roll-of factor of the raised-cosine pulse. This is parameter is optional. 1. Generate a vector x which contains 20 random bits. x round(rand(1.20)); 2. Using Fd = 1 and Fs = 5. modulate x using the line codes clinipolar nr', 'hipolar nr. 'manchester, and 'miller'. Plot the waveforms in one figure where each type of waveform is in a subplot. Use the MATLAB built-in function stairs to plot the waveforms. Here is an example: y-linecode(x, Fd, Fs, 'unipolar nrz'); T F/Fd; x axis (0length(y))T >>stairsx axis(1:length(y)),y) axisx axis()xaxi(engthy) minly)-0.5 max(y)H05)) S> 3. Repeat procedure 2 for 'bipolar r:', 'nyquist', and 'raised cosine'. Use alpha (the roll off factor) 0.2 for the raised cosine function. We would like to determine the minimum channel bandwidth W required to transmit each of the line codes we plotted above. The bandwidth requirement of a line code can be determined by plotting its power spectral density. Most of the line codes will have a power spectral density with a main lobe and many side lobes. The amplitude of the side lobes continually diminishes at higher frequencies. Generally, the bandwidth requirement of a line code W is determined by the location of the first null (or the width of the main lobe). This is true as long as the first null does not occur at f 0. If the first null occur at f 0, then W is determine by the location of the second spectral null 4. Task 3: Line codes and their spectrum Binary Source bits can be modulated by line codes to be transmitted through a baseband channel. There are several line codes that are used for such transmission. In this section, we will study some of the commonly used line codes and compute their power spectrum density. Download the MATLAB function linecode.m from the course website. This function has the following format linecode(bits, Fd, Fs, 'code type', alpha) It is a vector of binary bits to be encoded pulse) bit.code type is the encoding pulse shape. The supported code types are where: bits: Fd: t is the rate of the data transmission in symbols (bits) per second (1/duration of F It is the sampling frequency. Note that Fs/Fd represents the number ofsamples per nipolar m-, 'hipolar nr-', 'hipolar rz', 'manchester, 'miller' 'vquist', and raised cosine. alpha: It is a roll-of factor of the raised-cosine pulse. This is parameter is optional. 1. Generate a vector x which contains 20 random bits. x round(rand(1.20)); 2. Using Fd = 1 and Fs = 5. modulate x using the line codes clinipolar nr', 'hipolar nr. 'manchester, and 'miller'. Plot the waveforms in one figure where each type of waveform is in a subplot. Use the MATLAB built-in function stairs to plot the waveforms. Here is an example: y-linecode(x, Fd, Fs, 'unipolar nrz'); T F/Fd; x axis (0length(y))T >>stairsx axis(1:length(y)),y) axisx axis()xaxi(engthy) minly)-0.5 max(y)H05)) S> 3. Repeat procedure 2 for 'bipolar r:', 'nyquist', and 'raised cosine'. Use alpha (the roll off factor) 0.2 for the raised cosine function. We would like to determine the minimum channel bandwidth W required to transmit each of the line codes we plotted above. The bandwidth requirement of a line code can be determined by plotting its power spectral density. Most of the line codes will have a power spectral density with a main lobe and many side lobes. The amplitude of the side lobes continually diminishes at higher frequencies. Generally, the bandwidth requirement of a line code W is determined by the location of the first null (or the width of the main lobe). This is true as long as the first null does not occur at f 0. If the first null occur at f 0, then W is determine by the location of the second spectral null 4
Step by Step Solution
There are 3 Steps involved in it

Get step-by-step solutions from verified subject matter experts