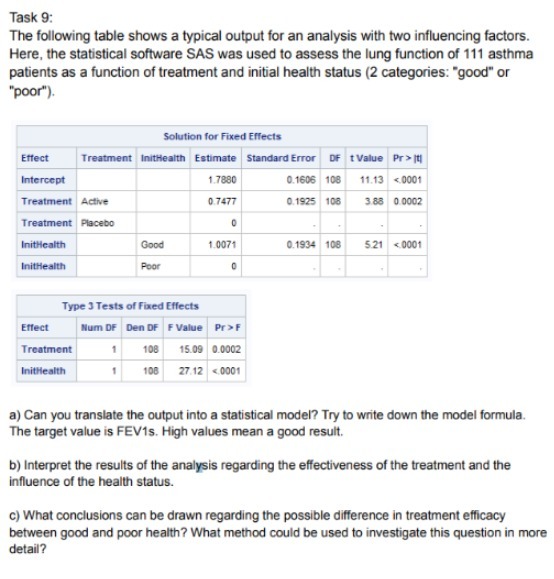
Question: Task 9: The following table shows a typical output for an analysis with two influencing factors. Here, the statistical software SAS was used to assess

Task 9: The following table shows a typical
Task 9: The following table shows a typical output for an analysis with two influencing factors. Here, the statistical software SAS was used to assess the lung function of 111 asthma patients as a function of treatment and initial health status (2 categories: "good" or "poor"). Solution for Fixed Effects Effect Treatment InitHealth Estimate Standard Error OF t Value Pr > It Intercept 1.7880 0.1606 108 11.13 F Treatment 108 15.09 0.0002 InitHealth 108 27.12 <.0001 a can you translate the output into statistical model try to write down formula. target value is fev1s. high values mean good result. b interpret results of analysis regarding effectiveness treatment and influence health status. c what conclusions be drawn possible difference in efficacy between poor method could used investigate this question more detail>

Step by Step Solution

There are 3 Steps involved in it

1 Expert Approved Answer
Step: 1 Unlock blur-text-image
Question Has Been Solved by an Expert!

Get step-by-step solutions from verified subject matter experts

Step: 2 Unlock
Step: 3 Unlock

Students Have Also Explored These Related Mathematics Questions!