

Question: Task C 4. Explain what the quantity _ xy means in this context. This study source was downloaded by 100000830466079 from CourseHero.com on 08-19-2021 15:49:49
Task C
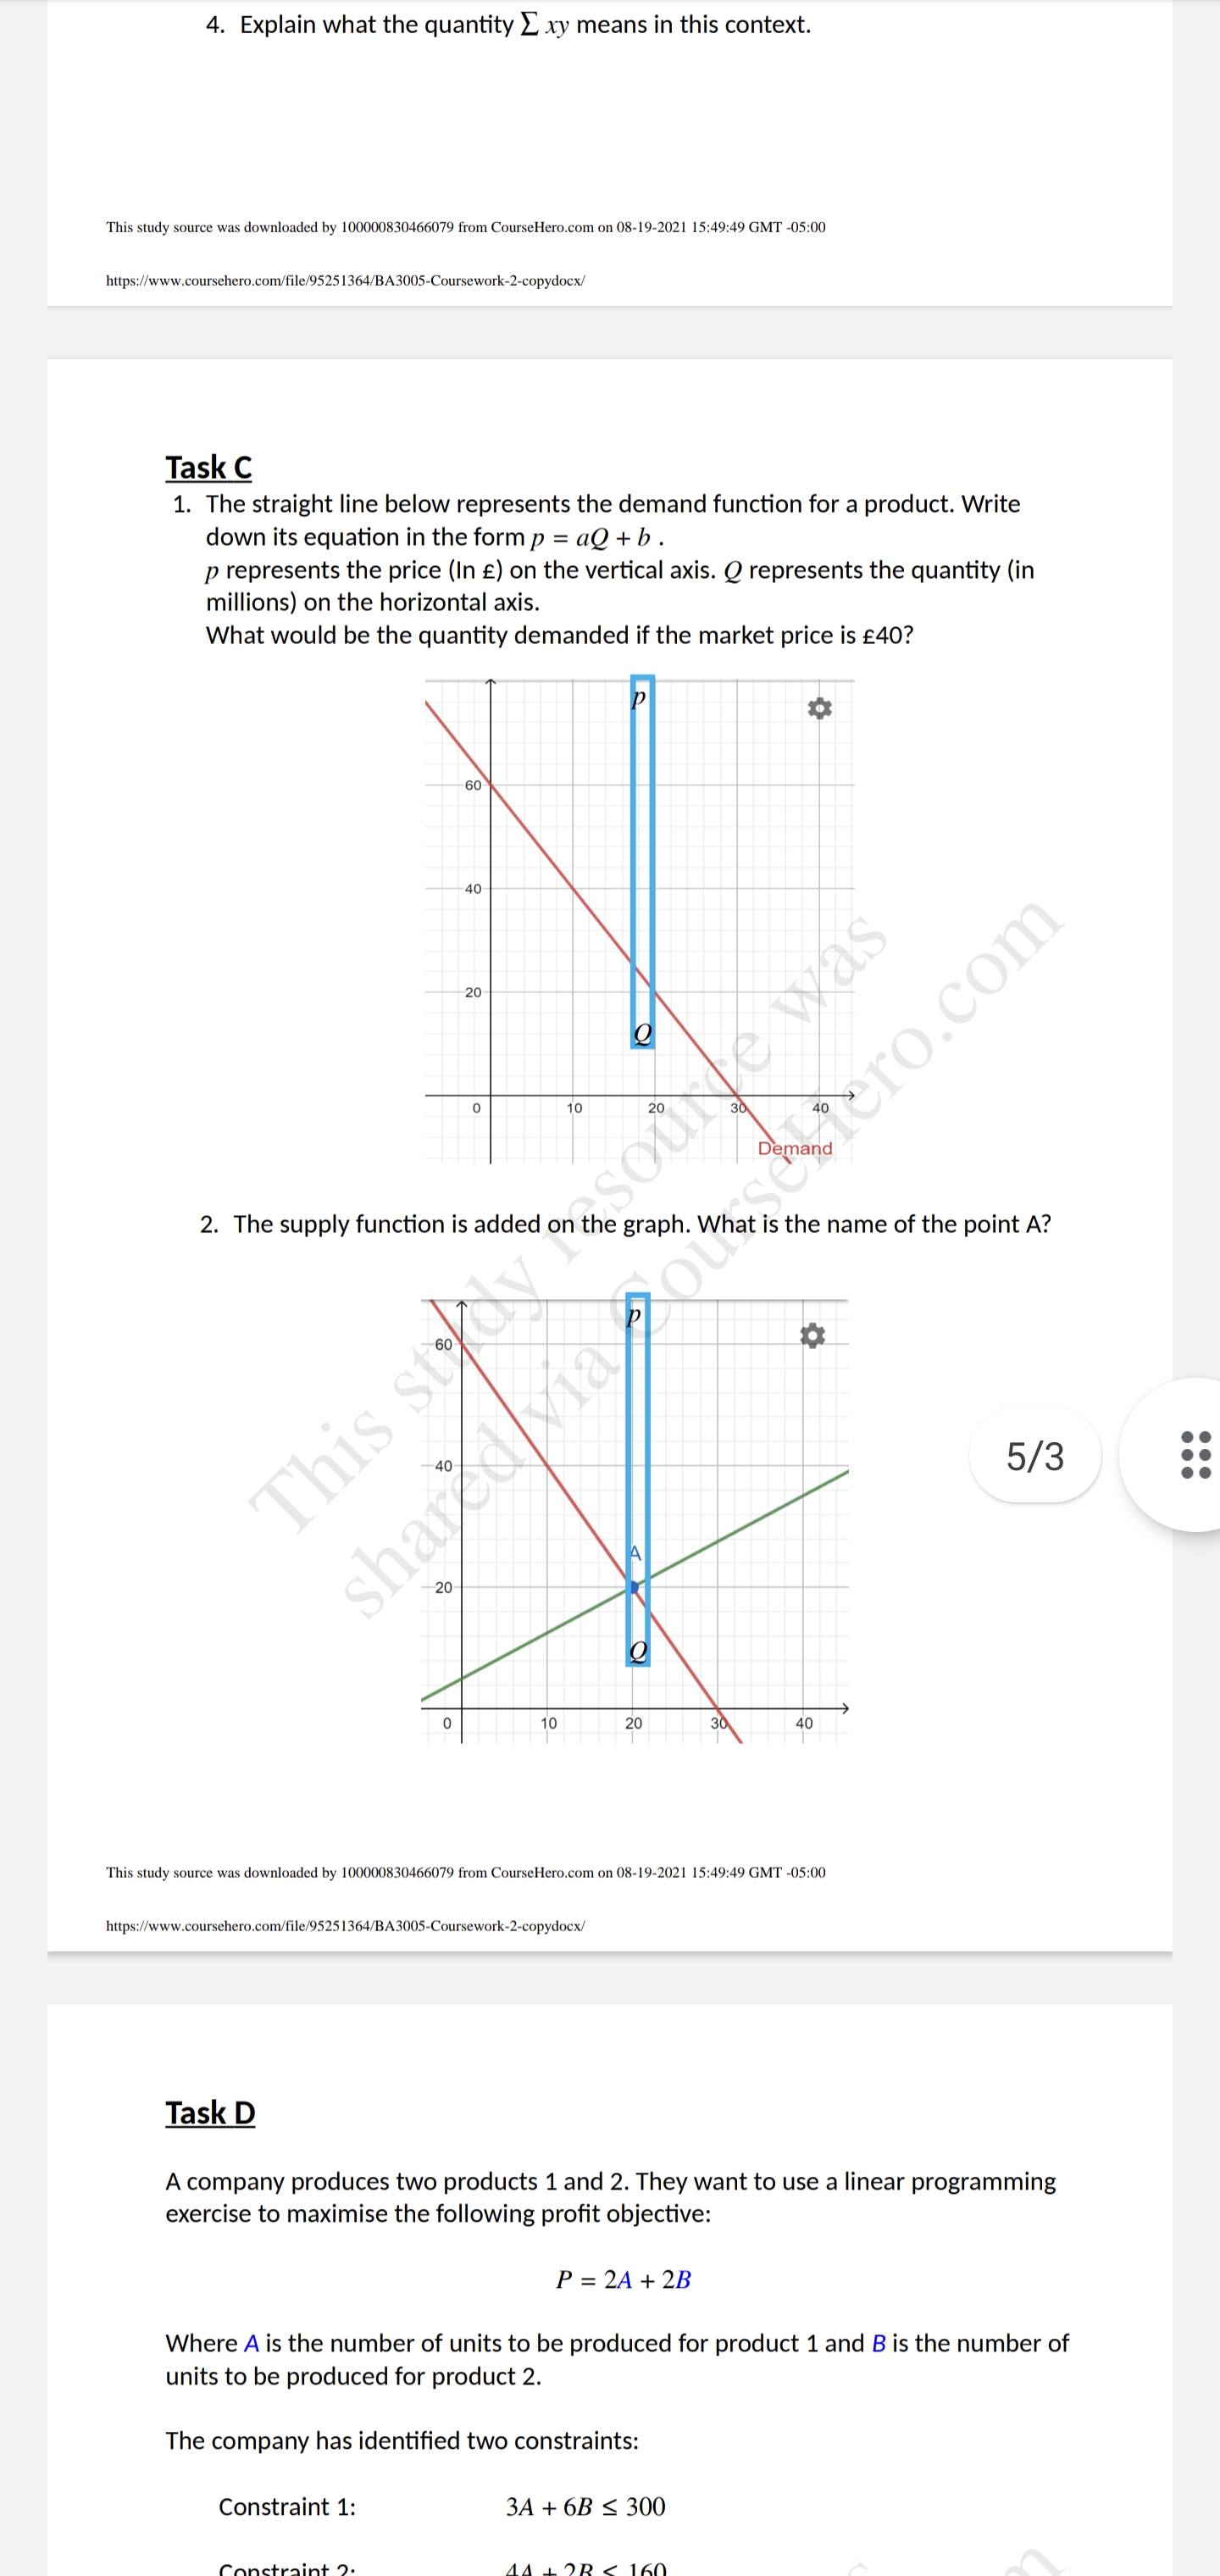
4. Explain what the quantity _ xy means in this context. This study source was downloaded by 100000830466079 from CourseHero.com on 08-19-2021 15:49:49 GMT -05:00 https://www.coursehero.com/file/95251364/BA3005-Coursework-2-copydocx/ Task C 1. The straight line below represents the demand function for a product. Write down its equation in the form p = al + b . p represents the price (In E) on the vertical axis. Q represents the quantity (in millions) on the horizontal axis. What would be the quantity demanded if the market price is E40? 60 40 yas 20 ero.com 10 Demand 2. The supply function is added on the graph. What is the name of the point A? This sto sharedvia 5/3 D 20 10 20 30 40 This study source was downloaded by 100000830466079 from CourseHero.com on 08-19-2021 15:49:49 GMT -05:00 https://www.coursehero.com/file/95251364/BA3005-Coursework-2-copydocx/ Task D A company produces two products 1 and 2. They want to use a linear programming exercise to maximise the following profit objective: P = 2A + 2B Where A is the number of units to be produced for product 1 and B is the number of units to be produced for product 2. The company has identified two constraints: Constraint 1: 3A + 6B
Step by Step Solution
There are 3 Steps involved in it

Get step-by-step solutions from verified subject matter experts