

Question: Task Description Building on your industry analysis from Assessment 1, you will now conduct a detailed financial analysis and valuation of Breville Group Limited (BRG).We
Task Description
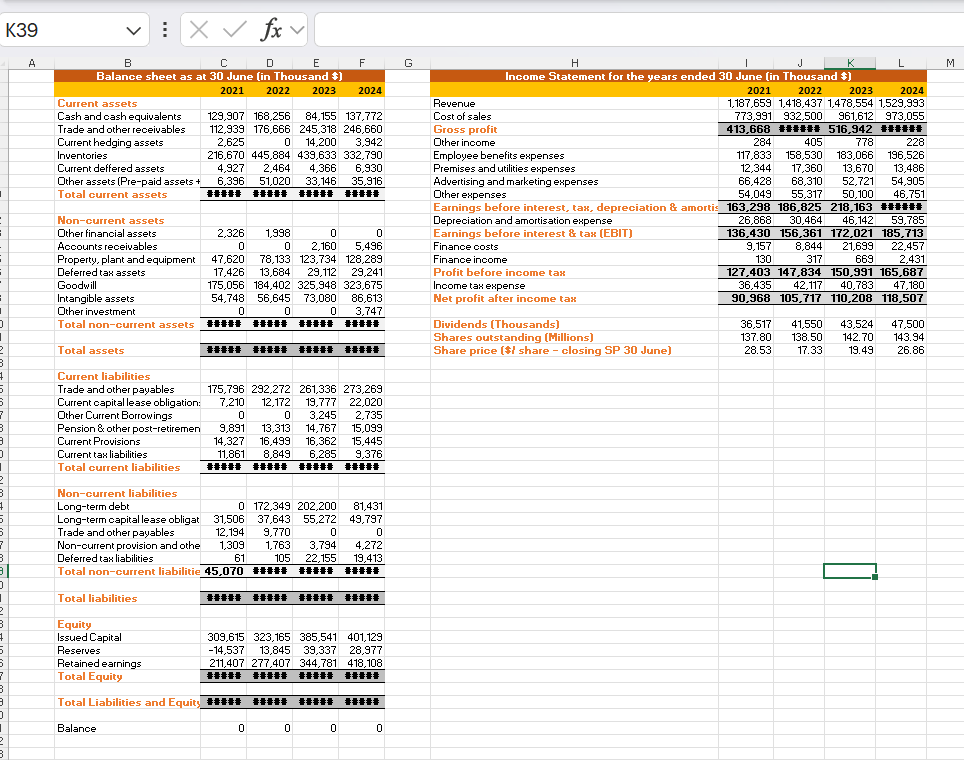
Building on your industry analysis from Assessment 1, you will now conduct a detailed financial analysis and valuation of Breville Group Limited (BRG).We entered the simplified financial statements into the downloadable Excel spreadsheet below for you. This assessment consists of four main parts:
Part 1: Financial Statement Analysis
- Conduct and interpret vertical analysis for BRG's balance sheets and income statements for four years. Draw figures to support your analysis.
- Conduct and interpret percentage change analysis (yoy) for BRG's balance sheets and income statements for three years. Draw figures to support your analysis.
- Conduct and interpret horizontal analysis for BRG's balance sheets and income statements for three years. Draw figures to support your analysis.
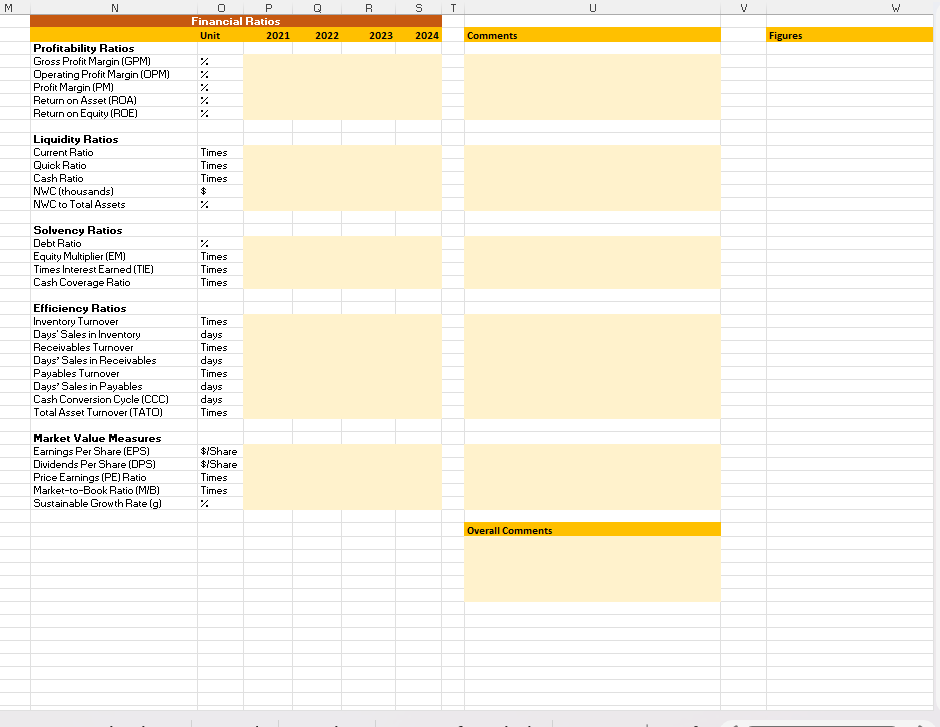
- Calculate and interpret financial ratios for BRG (profitability, liquidity, solvency, efficiency, and market value ratios) for four years. Draw figures to support your analysis.
- Provide insights into BRG's financial performance and position based on your ratio analysis.
Part 2: Valuation
- Loan Amortization: Assume BRG is considering opening 50 new stores across its markets. The project requires an initial investment of AUD 400 million (this includes all costs for store setup, equipment, and initial working capital). BRG will finance 75% of the new project (AUD 300 million) through loans and the annual interest rate is 6% for 12 years. Create a loan repayment schedule for the loan amortization. Your columns must include Year, Beginning Balance, Instalment, Interest, Principal, and Ending Balance. Discuss your analysis.
- Bond valuation: BRG will finance 75% of the new project (AUD 300 million) through issuing bonds. BRG will issue a bond on 1 July 2025 with a face value of $300 million for 12 years. The coupon rate is 10% per annum, and the yield to maturity is 6% per annum. Calculate the bond price on 1 July 2025. Interpret your analysis and determine the type of the bond.
- Equity valuation: Use the Dividend Discount Model (DDM) to value BRG's stock. Equity analysts forecast that BRG will pay dividends per share of $0.36 per share in 2025, growing at 4% annually. Calculate the fair share price of BRG in 2025, assuming the cost of equity is 10.5%. Discuss your analysis.
Part 3: Cost of Capital
- Cost of equity: Use the CAPM model to estimate BRG's cost of equity, assuming BRG has a beta of 0.98, a risk-free rate of 4.36%, and a market risk premium of 6.10%.
- Cost of debt: Assume a risk-free rate of 4.36%, and BRG's credit default spread (CDS) is 1.50%. Calculate BRG's cost of debt.
- Market capitalisation: Assume BRG has shares outstanding of 143.94 million shares in 2025, and the current market price is $31.62 per share. Calculate BRG's market capitalisation.
- Net debt: Assume BRG has a debt of 219,588 thousand dollars, and cash and cash equivalents of 137,772 thousand dollars. Calculate BRG's net debt.
- After-tax WACC: Estimate BRG's post-tax Weighted Average Cost of Capital (WACC).
Part 4: Capital Budgeting Analysis
- Assume BRG is considering opening 50 new stores across its markets. The project requires an initial investment of AUD 400 million (this includes all costs for store setup, equipment, and initial working capital) that will be fully depreciated over 12 years.
- BRG's new project expects to receive cash flows of $70 million at the end of each year for 12 years and a net income of $20 million at the end of each year for 12 years. The salvage value is $20 million at the end of 12 years.
- Assume BRG's new project post-tax WACC is 12%.
- Calculate the Net Present Value (NPV) for this project.
- Calculate the Internal Rate of Return (IRR) for this project.
- Calculate the Profitability Index (PI) for this project.
- Calculate the Modified Internal Rate of Return (MIRR) for this project.
- Calculate the Payback Period (PBP) for this project.
- Calculate the Discounted Payback Period (DPBP) for this project.
- Calculate the Accounting Rate of Return (ARR) for this project.
- Draw the relationship between NPV, IRR, and cost of capital
- Make an accept/reject recommendation based on your analysis, considering both quantitative and qualitative factors.
Step by Step Solution
There are 3 Steps involved in it
1 Expert Approved Answer
Step: 1 Unlock

Question Has Been Solved by an Expert!
Get step-by-step solutions from verified subject matter experts
Step: 2 Unlock
Step: 3 Unlock