

Question: Task Instructions Consider the performance measures that Z'Cheddr should track regularly on an executive dashboard. Describe the performance measures that Mr. Z should be reviewing
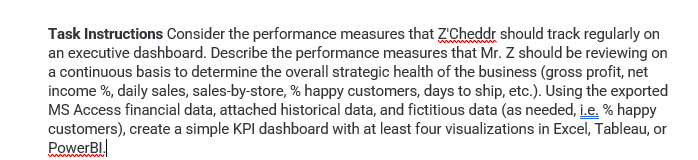
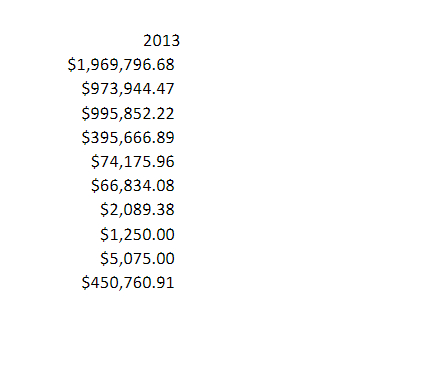
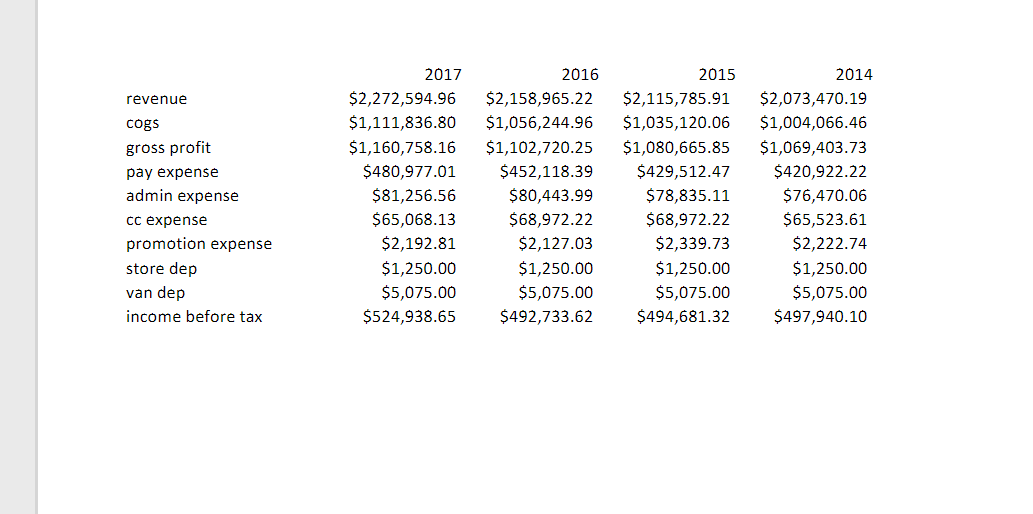
Task Instructions Consider the performance measures that Z'Cheddr should track regularly on an executive dashboard. Describe the performance measures that Mr. Z should be reviewing on a continuous basis to determine the overall strategic health of the business (gross profit, net income %, daily sales, sales-by-store, % happy customers, days to ship, etc.). Using the exported MS Access financial data, attached historical data, and fictitious data (as needed, i.e. % happy customers), create a simple KPI dashboard with at least four visualizations in Excel, Tableau, or PowerBI! 2013 $1,969,796.68 $973,944.47 $995,852.22 $395,666.89 $74,175.96 $66,834.08 $2,089.38 $1,250.00 $5,075.00 $450,760.91 revenue cogs gross profit pay expense admin expense cc expense promotion expense store dep van dep income before tax 2017 $2,272,594.96 $1,111,836.80 $1,160,758.16 $480,977.01 $81,256.56 $65,068.13 $2,192.81 $1,250.00 $5,075.00 $524,938.65 2016 $2,158,965.22 $1,056,244.96 $1,102,720.25 $452,118.39 $80,443.99 $68,972.22 $2,127.03 $1,250.00 $5,075.00 $492,733.62 2015 $2,115,785.91 $1,035,120.06 $1,080,665.85 $429,512.47 $78,835.11 $68,972.22 $2,339.73 $1,250.00 $5,075.00 $494,681.32 2014 $2,073,470.19 $1,004,066.46 $1,069,403.73 $420,922.22 $76,470.06 $65,523.61 $2,222.74 $1,250.00 $5,075.00 $497,940.10 Task Instructions Consider the performance measures that Z'Cheddr should track regularly on an executive dashboard. Describe the performance measures that Mr. Z should be reviewing on a continuous basis to determine the overall strategic health of the business (gross profit, net income %, daily sales, sales-by-store, % happy customers, days to ship, etc.). Using the exported MS Access financial data, attached historical data, and fictitious data (as needed, i.e. % happy customers), create a simple KPI dashboard with at least four visualizations in Excel, Tableau, or PowerBI! 2013 $1,969,796.68 $973,944.47 $995,852.22 $395,666.89 $74,175.96 $66,834.08 $2,089.38 $1,250.00 $5,075.00 $450,760.91 revenue cogs gross profit pay expense admin expense cc expense promotion expense store dep van dep income before tax 2017 $2,272,594.96 $1,111,836.80 $1,160,758.16 $480,977.01 $81,256.56 $65,068.13 $2,192.81 $1,250.00 $5,075.00 $524,938.65 2016 $2,158,965.22 $1,056,244.96 $1,102,720.25 $452,118.39 $80,443.99 $68,972.22 $2,127.03 $1,250.00 $5,075.00 $492,733.62 2015 $2,115,785.91 $1,035,120.06 $1,080,665.85 $429,512.47 $78,835.11 $68,972.22 $2,339.73 $1,250.00 $5,075.00 $494,681.32 2014 $2,073,470.19 $1,004,066.46 $1,069,403.73 $420,922.22 $76,470.06 $65,523.61 $2,222.74 $1,250.00 $5,075.00 $497,940.10
Step by Step Solution
There are 3 Steps involved in it

Get step-by-step solutions from verified subject matter experts