

Question: TASK: read the case study and answer the following questions below CASE STUDY Harley Davidson New York Who wants to ride a Harley Davidson? It
TASK: read the case study and answer the following questions below
CASE STUDY
Harley Davidson New York Who wants to ride a Harley Davidson?
It was winter in New York City and Asaf Jacobis Harley-Davidson dealership was doing reasonable business, but it wasnt enough. Jacobi went for a long walk in Riverside Park and happened to bump into Or Shani, CEO of an AI (Artificial Intelligence) firm, Adgorithms. After discussing Jacobis sales woes, Shani suggested he try out Albert, Adgorithms AI-driven marketing platform. It works across digital channels like Facebook and Google to measure and autonomously optimise the outcomes of marketing campaigns. Jacobi decided hed give Albert a one-weekend audition. That weekend Jacobi sold 15 motorcycles. It was almost twice his all-time summer weekend sales record of eight. Naturally, Jacobi decided to trial Albert to determine future growth opportunities and strategy. In addition, previously Jacobis dealership had only offered motorcycles for sale. So, at the start of the Albert trial, Jacobi introduced motorcycle gear (helmets, gloves, protective clothing & footwear) as an additional offering.
The impact on sales:
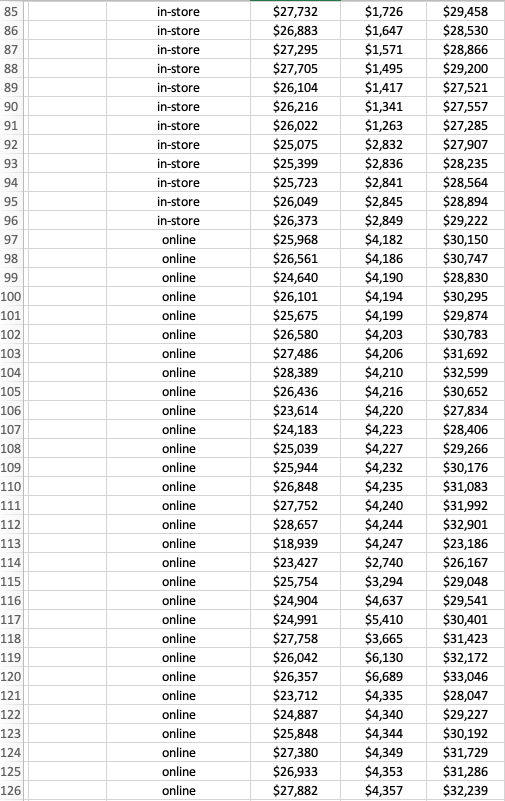
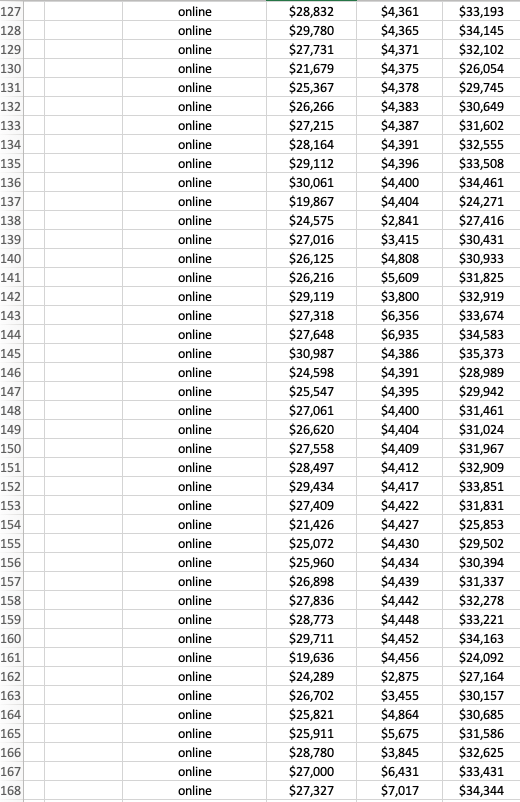
The use of Albert had an immediate impact on operations. The dealership went from getting one qualified lead per day to 40. In the first month, 15% of those new leads were lookalikes, meaning that the people calling the dealership to set up a visit resembled previous high-value customers and therefore were more likely to make a purchase. By the third month, the dealerships leads had increased 2930%, 50% of them lookalikes. Effectively, Jacobi had estimated that only 2% of New York Citys population were potential buyers, Albert revealed that his target market was larger much larger and began finding customers Jacobi didnt even know existed. These included out-of-state buyers who were willing to purchase a motorcycle and associated gear through the dealers online shopping channel. This was an interesting development for Jacobi, given net margin (profit) on motorcycles is 15.7%, while net margin on gear is 57.5%.
What does the future hold?
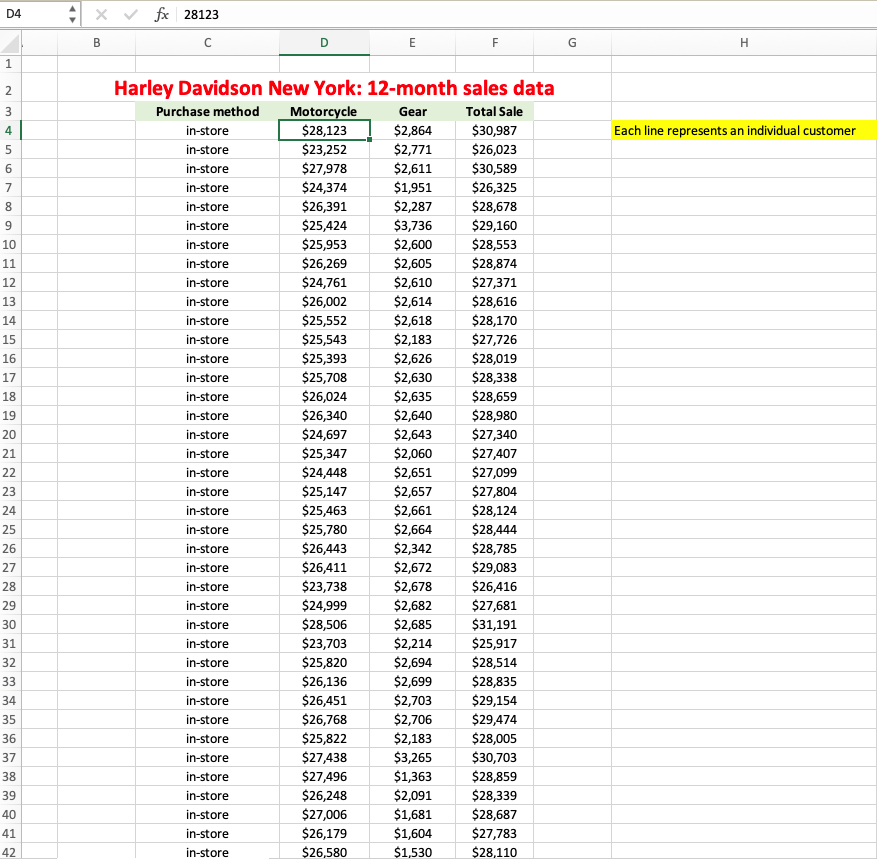
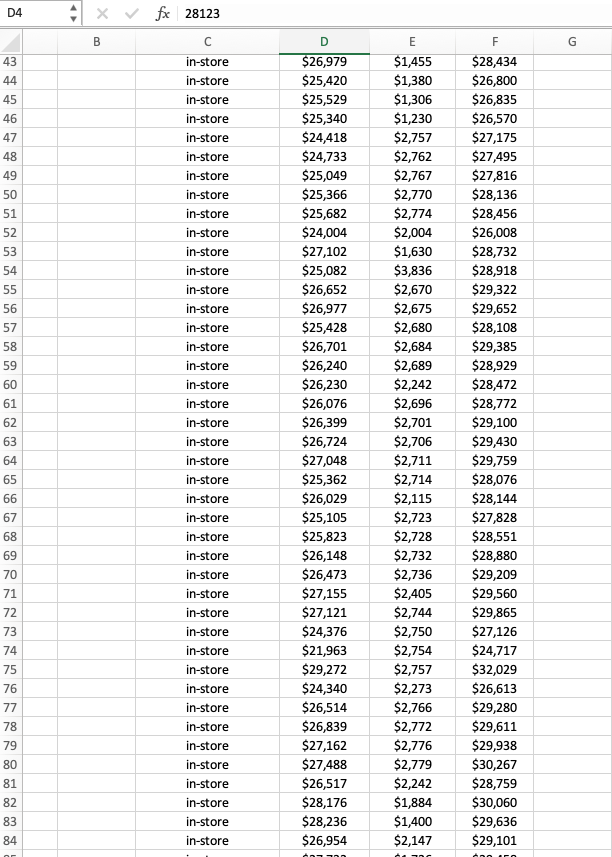
At the end of the trial, Jacobi had some major decisions to make. He has already set up a small call centre with three employees - to handle all new business. He now has $100K to invest back into the business and wants to know whether he should use that to include a new product in his range. Jacobi decided to analyse the relevant data from the previous 12-months sales report to guide his decision.
*Answer the following question (1000 words): You have been hired by Jacobi to analyse the data and provide the necessary reports to help him decide which option will be best for the dealership. He has set out some key information that he requires:
Question 1: Over the twelve months, what is the total sales for the dealership, and how is this broken down across in-store and online sales? (calculate in excel formula = SUM = AVERAGE) Provide a relevant chart with your answer clearly detailing the necessary information. Justify why you used that type of chart.
Question 2: On average, what are customers spending on motorcycles in-store and online? Choose a different chart (to that used in Q1) to visualise this information. Justify why you used that type of chart.
Step by Step Solution
There are 3 Steps involved in it

Get step-by-step solutions from verified subject matter experts