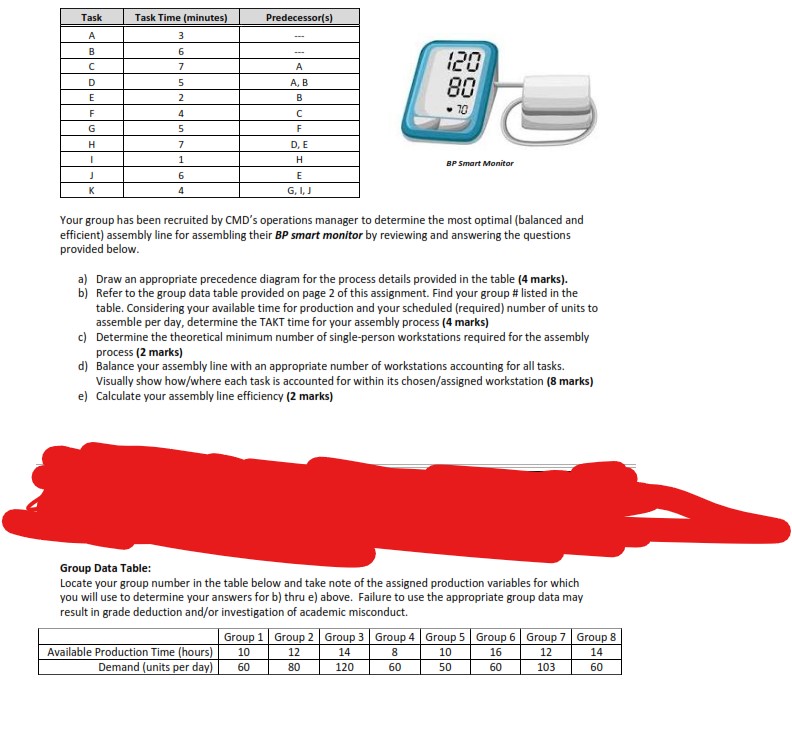
Question: Task Task Time (minutes) Predecessor(s) 3 6 7 A 120 A, B B 80 C - 70 5 F D. E H BP Smart Monitor
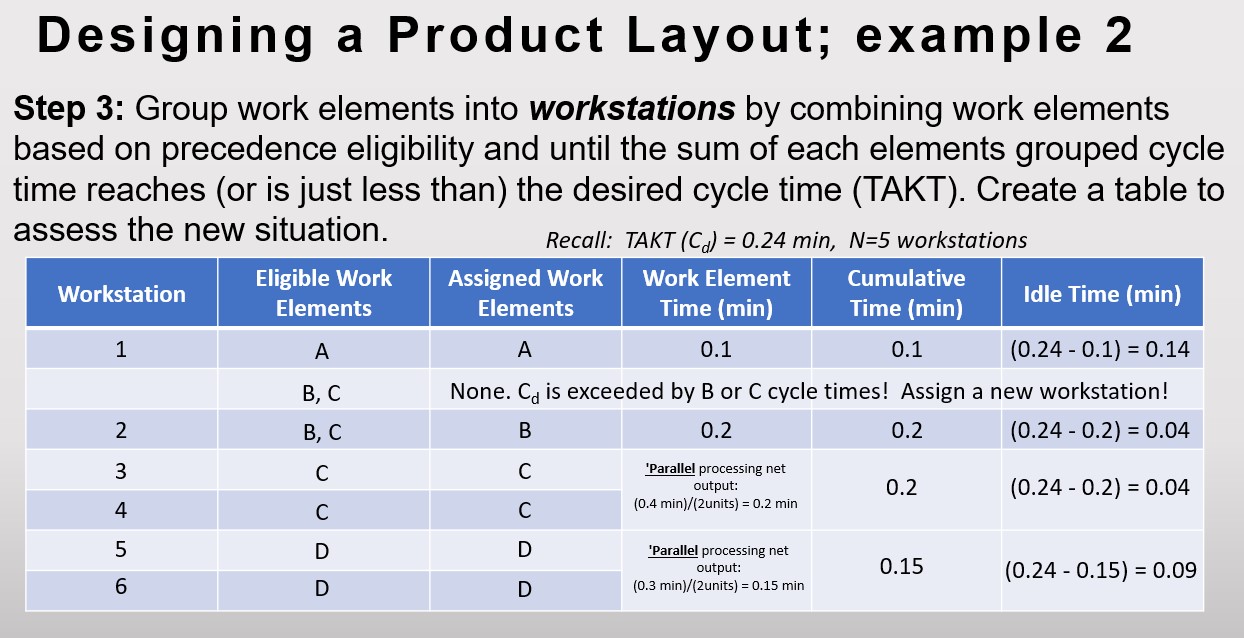
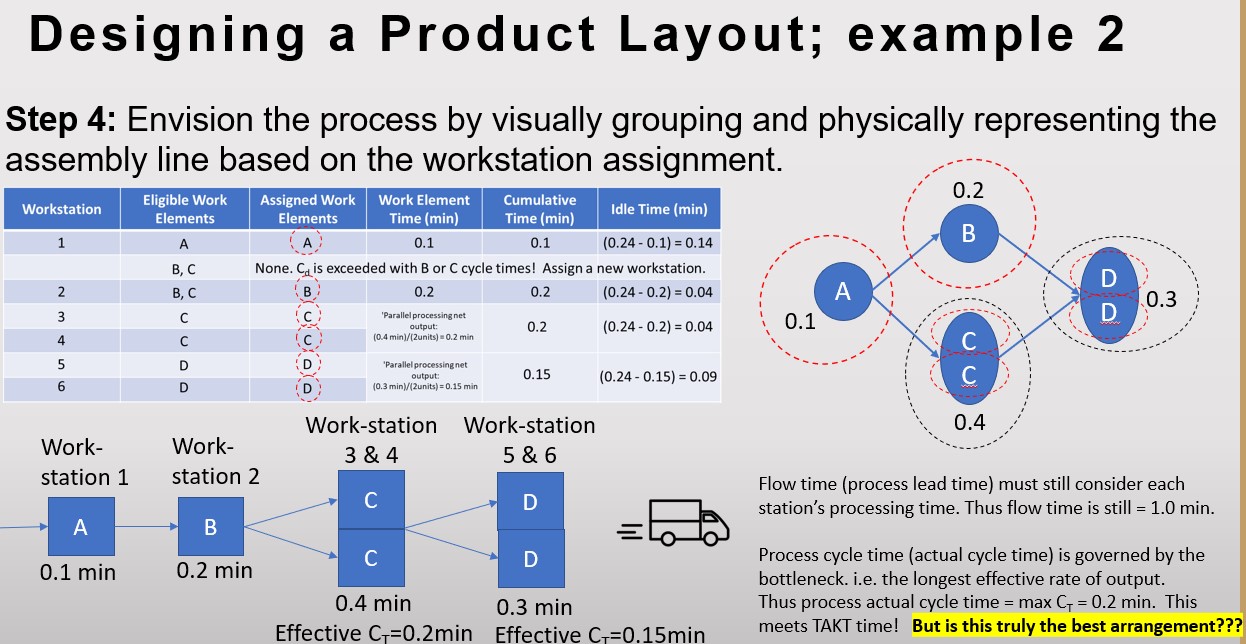
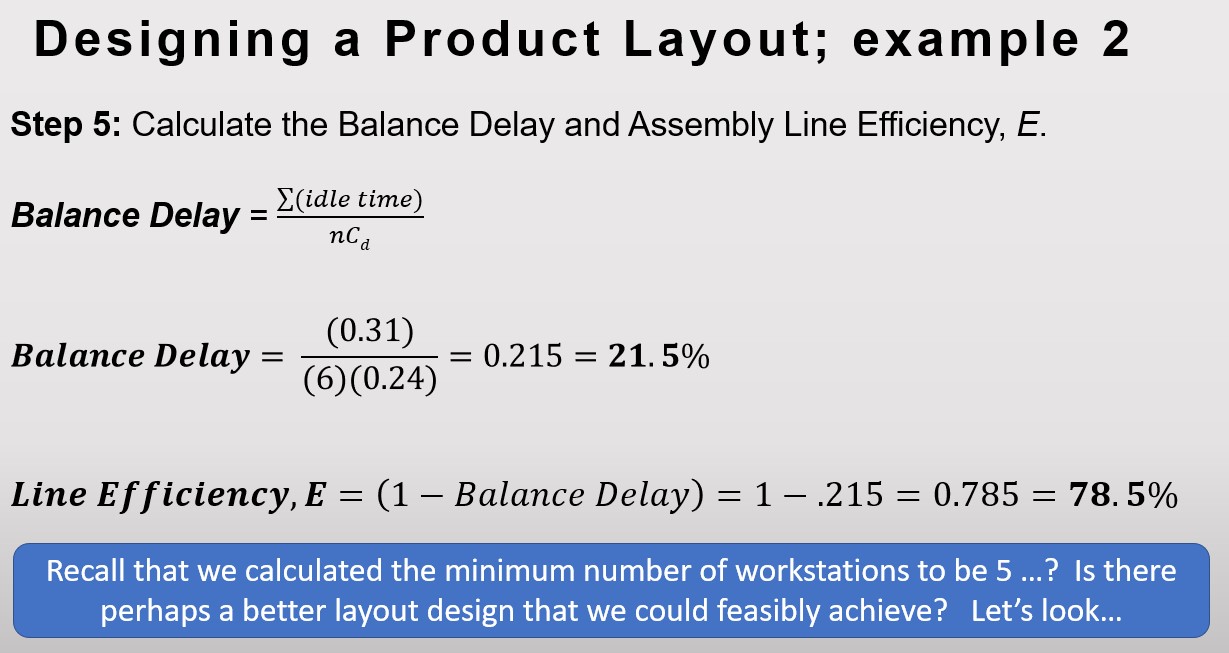
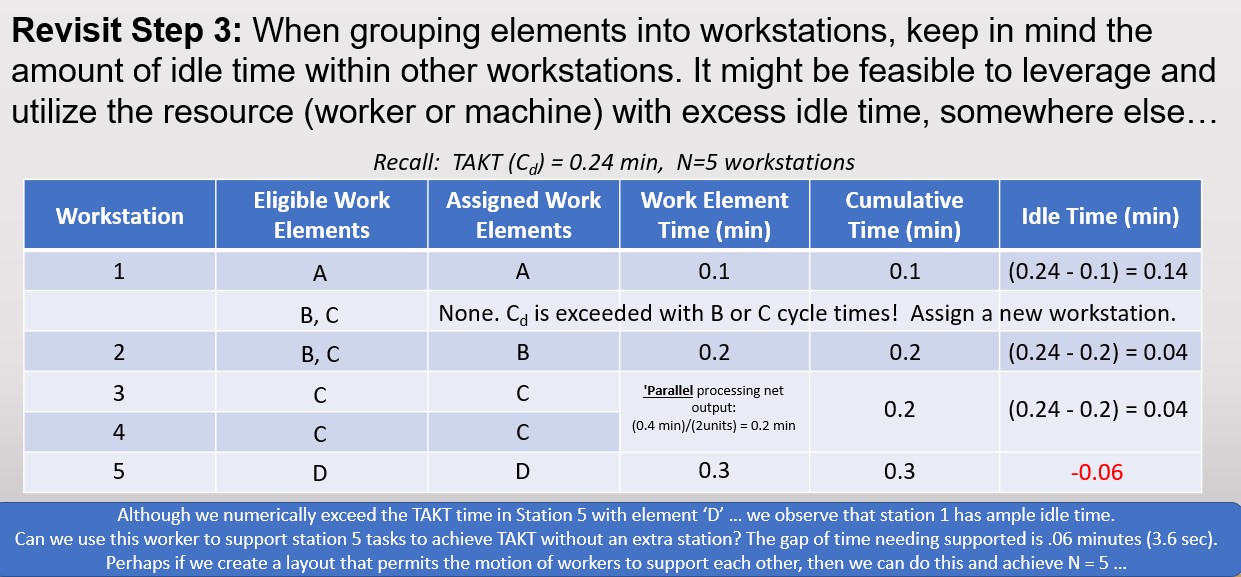
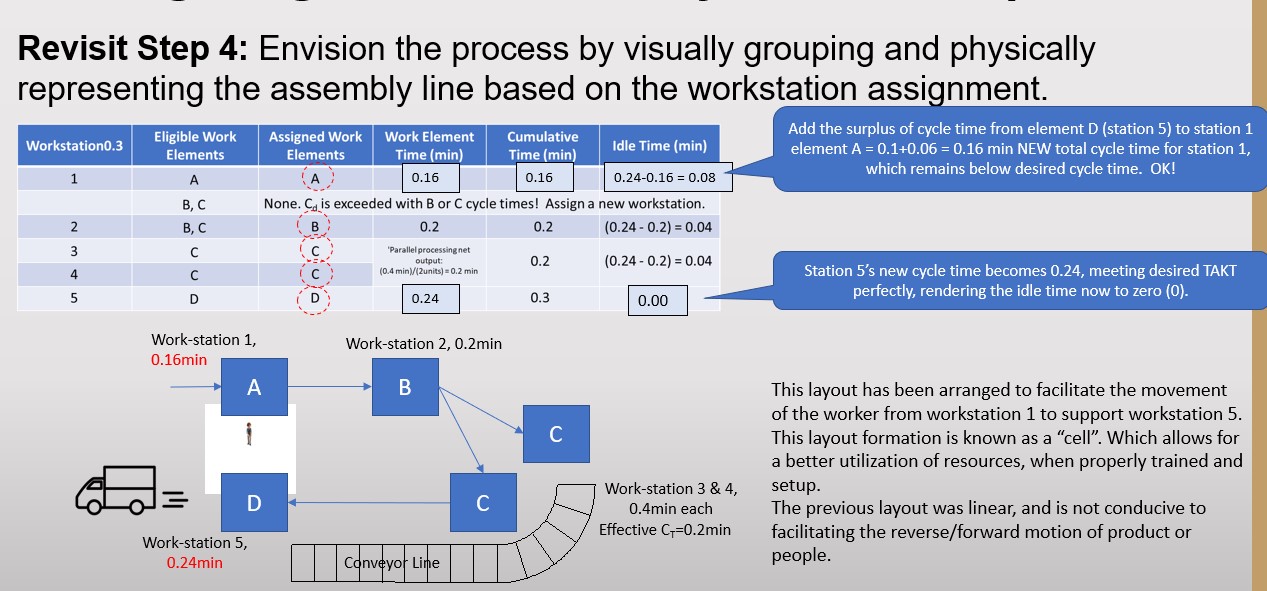
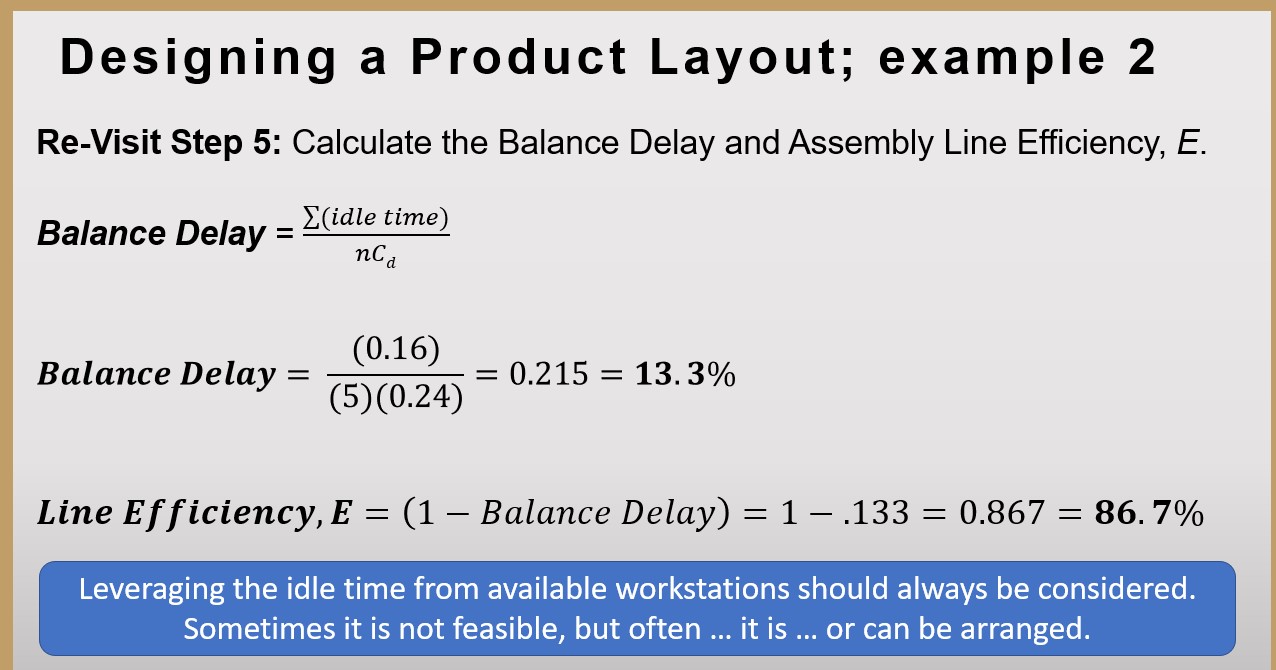
Task Task Time (minutes) Predecessor(s) 3 6 7 A 120 A, B B 80 C - 70 5 F D. E H BP Smart Monitor E Your group has been recruited by CMD's operations manager to determine the most optimal (balanced and efficient) assembly line for assembling their BP smart monitor by reviewing and answering the questions provided below. a) Draw an appropriate precedence diagram for the process details provided in the table (4 marks). b) Refer to the group data table provided on page 2 of this assignment. Find your group # listed in the table. Considering your available time for production and your scheduled (required) number of units to assemble per day, determine the TAKT time for your assembly process (4 marks) c) Determine the theoretical minimum number of single-person workstations required for the assembly process (2 marks) d) Balance your assembly line with an appropriate number of workstations accounting for all tasks. Visually show how/where each task is accounted for within its chosen/assigned workstation (8 marks) e) Calculate your assembly line efficiency (2 marks) Group Data Table: Locate your group number in the table below and take note of the assigned production variables for which you will use to determine your answers for b) thru e) above. Failure to use the appropriate group data may result in grade deduction and/or investigation of academic misconduct. Group 1 |Group 2 |Group 3 |Group 4| Group 5|Group 6 |Group 7 |Group 8 Available Production Time (hours) 10 12 14 10 16 12 14 Demand (units per day) 60 80 120 60 50 60 103 60Designing a Product Layout; example 2 Step 3: Group work elements into workstations by combining work elements based on precedence eligibility and until the sum of each elements grouped cycle time reaches (or is just less than) the desired cycle time (TAKT). Create a table to assess the new situation. Recall: TAKT (Cd) = 0.24 min, N=5 workstations Eligible Work Assigned Work Work Element Cumulative Workstation Elements Elements Time (min) Time (min) Idle Time (min) 1 A A 0.1 0.1 (0.24 - 0.1) = 0.14 B, C None. Ca is exceeded by B or C cycle times! Assign a new workstation! 2 B, C B 0.2 0.2 (0.24 - 0.2) = 0.04 C 'Parallel processing net W output: 0.2 (0.24 - 0.2) = 0.04 C (0.4 min)/(2units) = 0.2 min D 'Parallel processing net output: 0.15 (0.24 - 0.15) = 0.09 (0.3 min)/(2units) = 0.15 minDesigning a Product Layout; example 2 Step 4: Envision the process by visually grouping and physically representing the assembly line based on the workstation assignment. 0.2 Workstation Eligible Work Assigned Work Work Element Cumulative Elements Elements Time (min) Time (min) Idle Time (min) A A 0.1 0.1 (0.24 - 0.1) = 0.14 B B, C None. C. is exceeded with B or C cycle times! Assign a new workstation. D N B, C B 0.2 0.2 (0.24 - 0.2) = 0.04 A 0.3 W C C 'Parallel processing net D output: 0.2 (0.24 - 0.2) = 0.04 0.1 C (0.4 min)/[2units) = 0.2 min C D D 'Parallel processing net output 0.15 D (0.24 - 0.15) = 0.09 D (0.3 min)/(2units) =0.15 min C Work-station Work-station 0.4 Work- Work- 3 & 4 5 & 6 station 1 station 2 Flow time (process lead time) must still consider each C D station's processing time. Thus flow time is still = 1.0 min. A B 0.2 min C D Process cycle time (actual cycle time) is governed by the 0.1 min bottleneck. i.e. the longest effective rate of output. 0.4 min 0.3 min Thus process actual cycle time = max CT = 0.2 min. This Effective CT=0.2min Effective CT=0.15min meets TAKT time! But is this truly the best arrangement???Designing a Product Layout; example 2 Step 5: Calculate the Balance Delay and Assembly Line Efficiency, E. Balance Delay = W B l D l (0'31) 0215 21 Sty a ance B a = = . = . 3' (6)(0.24) Line Efficiency,E : (1 Balance Delay) : 1 .215 = 0.785 = 78. 5% Recall that we calculated the minimum number of workstations to be 5 ...? Is there perhaps a better layout design that we could feasibly achieve? Let's look... Revisit Step 3: When grouping elements into workstations, keep in mind the amount of idle time within other workstations. It might be feasible to leverage and utilize the resource (worker or machine) with excess idle time, somewhere else... Recall: TAKT (Cd) = 0.24 min, N=5 workstations Work Element Cumulative Workstation Eligible Work Assigned Work Elements Elements Time (min) Time (min) Idle Time (min) A A 0.1 0.1 (0.24 - 0.1) = 0.14 B, C None. Cd is exceeded with B or C cycle times! Assign a new workstation. B, C B 0.2 0.2 (0.24 - 0.2) = 0.04 C C 'Parallel processing net output: 0.2 (0.24 - 0.2) = 0.04 UI A W C C (0.4 min)/(2units) = 0.2 min O D 0.3 0.3 -0.06 Although we numerically exceed the TAKT time in Station 5 with element 'D' ... we observe that station 1 has ample idle time. Can we use this worker to support station 5 tasks to achieve TAKT without an extra station? The gap of time needing supported is .06 minutes (3.6 sec). Perhaps if we create a layout that permits the motion of workers to support each other, then we can do this and achieve N = 5 ..Revisit Step 4: Envision the process by visually grouping and physically representing the assembly line based on the workstation assi-nment. Work Ele me nt Time {min} Add the surplus of cycle time from element D [station 5) to station 1 element A = U.1+D.i]6 = 0.16 min NEW total cycle time for station 1, which remains below desired cycle time. OKi Cumulative Time [mini Idle Time {min} 1 A :'A ,: 0.240.16 = 0.03 B, C None. FATS exceeded with B or C cycle times! Assign a new workstation. 2 B, c (3):; 0.2 0.2 (0.24 - 0.2) = 0.04 3 C [PE-z: """\"':J:':\"\""" 0.2 (0.24 0.2) = 0.04 . , . . . 4 C '. E : :n.aminm2umu1=u.2 min Station 5 s new cycle time becomes 0.24, meeting desired TAKT 5 D (\"6\": 024 0'3 (100 perfectly, rendering the idle time now to zero {0). Workstation 1: Workstation 2, 0.2min 0.16min "' This layout has been arranged to facilitate the movement of the worker from workstation 1 to support workstation 5. l This layout formation is known as a "cell". Which allows for a better utilization of resources, when properly trained and _ Workstation 3 8r 4, setup. *7 0.4min each The previous layout was linear, and is not conducive to Work station 5' Eedive CEO-2min facilitating the reverse/forward motion of product or 0.24min l Cclnv+ynr Line people. Designing a Product Layout; example 2 Re-Visit Step 5: Calculate the Balance Delay and Assembly Line Efficiency, E. Balance Delay = E(idle time) nc a (0.16) Balance Delay = = 0.215 = 13. 3% (5) (0.24) Line Efficiency, E = (1 - Balance Delay) = 1 -.133 = 0.867 = 86. 7% Leveraging the idle time from available workstations should always be considered. Sometimes it is not feasible, but often ... it is ... or can be arranged
Step by Step Solution
There are 3 Steps involved in it
1 Expert Approved Answer
Step: 1 Unlock
Question Has Been Solved by an Expert!
Get step-by-step solutions from verified subject matter experts
Step: 2 Unlock
Step: 3 Unlock
Students Have Also Explored These Related Accounting Questions!