

Question: TASK TWO-SUMMATIVE This final task must be submitted for final marking. Prepare the spreadsheet below in Excel and use it to answer Questions 1 to
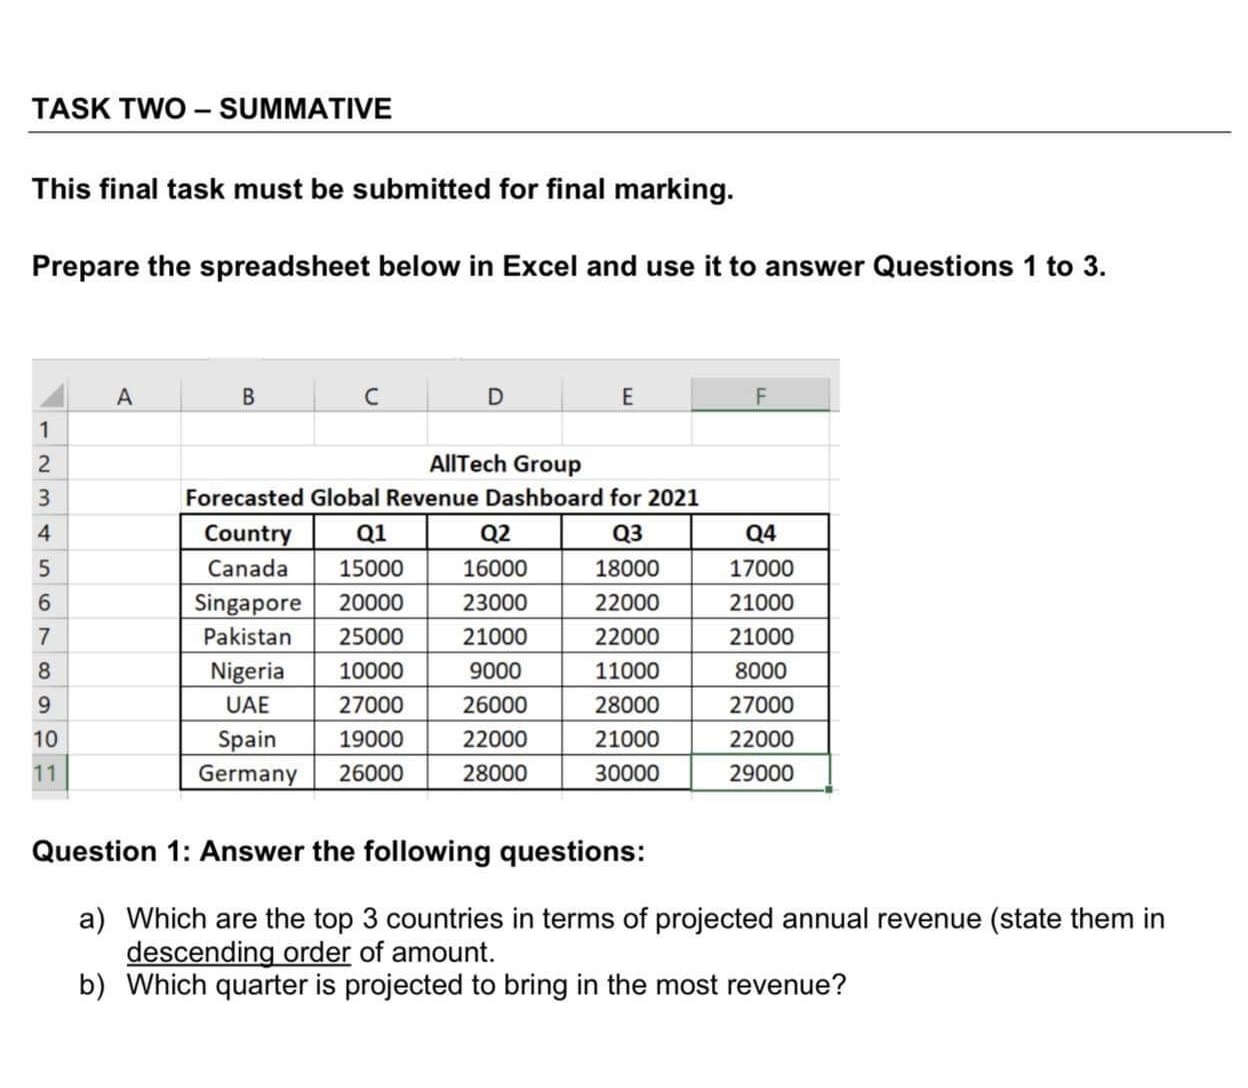

TASK TWO-SUMMATIVE This final task must be submitted for final marking. Prepare the spreadsheet below in Excel and use it to answer Questions 1 to 3. B D E F 1 2 3 4 5 6 AllTech Group Forecasted Global Revenue Dashboard for 2021 Country Q1 Q2 Q3 Canada 15000 16000 18000 Singapore 20000 23000 22000 Pakistan 25000 21000 22000 Nigeria 10000 9000 11000 UAE 27000 26000 28000 Spain 19000 22000 21000 Germany 26000 28000 30000 0 000 Q4 17000 21000 21000 8000 7 8 9 10 11 27000 22000 29000 Question 1: Answer the following questions: a) Which are the top 3 countries in terms of projected annual revenue (state them in descending order of amount. b) Which quarter is projected to bring in the most revenue? Question 2 a) Produce an appropriate fully labelled chart to reflect the quarterly totals for each region. b) Use a suitable and fully labelled chart to reflect the contribution of each region to the overall project annual revenue. Question 3 Imagine a scenario where you are the CEO of the AllTech group. What information could you gather from calculating the mean, median, mode, and range of each region? Discuss the importance of each measure of central tendency separately (max. 300 words)
Step by Step Solution
There are 3 Steps involved in it

Get step-by-step solutions from verified subject matter experts